Ultimate Income Strategies
How to Get the Most Out of This Book

Thank you for accessing the “Ultimate Income Strategies” eBook. This book is designed for beginning, intermediate and advanced traders. The authors in this book are leading experts in trading Stocks, Options, Futures and Forex.

As you read this book, you will be exposed to multiple strategies that have high probabilities of success and/or high profit. Many of the strategies in this book are divided into three sections:

In short, you will have all of the information you need to trade your new favorite strategy tomorrow. Some of the things you will learn in this book are:

At 52Patterns.com, it is our sincere hope that you take away several strategies that you can use when you are done reading this book. You will also learn about markets that you currently don’t trade, and you will find out if they are suited to your trading personality.  

Finally, make sure to subscribe to 52Patterns.com. We provide free eBooks, reports, on-demand videos and many other publications for active traders in all of the markets. Our presenters are world-renowned industry veterans and our content is provided free of charge in a relaxed and friendly setting. Cheers to your trading success!

Chapter
01

The #1 Way to Make Weekly Income with Weekly Options In Any Market Condition

By Jack Carter, SuperiorInformation.com

Trading weekly options can be a great way to generate consistent weekly income, but the key is to learn how to trade them the right way. In this discussion, you will learn how most people trade weekly options and why they fail. Next you will learn a simple strategy for trading weekly options that can consistently put money into your account on a weekly basis.

Weekly Options

“Weekly options are the biggest game changer for the independent investor since the invention of the Internet.”

And now, thanks to three recent changes in the options market, you can get an even bigger advantage. Here’s why. The first big change:

  1. The invention of weekly options. Normal options are listed in months. You can buy and sell stock options several months out in time. Weekly options expire weekly. These weekly options give you a new way to trade.
  2. Weekly options volume has soared. When weekly options first got traction back in 2010, they were small in scope and volume. But by 2016, weekly options volume skyrocketed. This gives you a liquidity advantage.
  3. The number of stocks with available weekly options has grown 200%. The list of stocks is at the point where you can now find several great weekly options trades, regardless of market conditions.

As a result of these changes, you get great liquidity and more available trading opportunities with weekly options.

I’m Jack Carter, and I have over 30 years and close to $1 billion in trading experience. I was trained at the World Trade Center in 1985. I traded throughout the largest up and down market in history. My record was over $8 million of stock in one day.

In my career, I’ve been a stockbroker, a NASDAQ market maker, a professional day trader, and a hedge fund manager. But most importantly, I’ve successfully taught traders from 43 countries to make profit-rich trades. I’m not telling you all of this to impress you, rather to impress upon you that this is 100% real, not some hypothetical stuff some guy made up but never made any real money on.

Now I’ve discovered what I believe is the biggest trading advantage for the little guy since the invention of the Internet.

The #1 Way to Make Weekly Income With Weekly Options!

After losing my own money early in 1984 as a stockbroker, I went on to find success with options after working as a hedge fund trader. From this experience, I can save you a lot of time and lost money right now.

At some point in your journey, if you don’t get wiped out along the way, you’ll discover that there are definitely winners and losers in the options market. The reason is because options are a “zero sum” game. But it’s simpler than that. Here’s why:

When you own a stock, you can own it forever.

But when you own an option, it’s only good for a certain amount of time, until expiration. And the cold hard truth is that most options expire worthless.

The reason is, because options buyers run out of time.

This means options buyers lose all their money most of the time.

The real money in the options market is in selling options

The odds are in your favor, simply by being an options seller.

Weekly options give you a huge edge because they expire every week.

This means you can make weekly income selling weekly options that expire worthless.

But how can you make it work

There are three parts to this.

  • Part 1. The stocks
  • Part 2. The options
  • Part 3. The strategy – getting paid

Part 1: The stocks

This is the most important part. Not all stocks have available weekly options. And the ones that do aren’t always good to trade.

First and foremost, we want a stock with available weekly options that’s in a good trend. We take the list and look at each stock with available weekly options and narrow it down to three to five of them that are in good trends

Part 2: The options

There are only two types of options, puts and calls. And there are only two things you can do with options—you can buy puts and calls or you can sell puts and calls. If you buy a put option, you own the right to “put” the stock to someone at the strike price until expiration. If you sell a put, you sold someone the right to “put” it to you at the strike price until expiration.

If you buy a call option, you own the right to “call” the stock away at the strike price until expiration. If you sell a call, you sell someone the right to “call” it away from you.

Part 3: The strategy

I’ve already given you the million-dollar secret to making money with options—be an options seller. The reason is because most options expire worthless. Time decay is what makes them expire worthless.

So we profit by selling options while they still have some time value, and we profit when they expire worthless four days later. Most of the time, using put options works best. Which put options expire worthless? The simple answer is: any put options at strike prices that are “out of the money” at the close of the market every Friday.

Here’s an Example

Let’s use a stock called XYZ as an example. If XYZ stock price closes on Friday over $100 per share, then any put option with a strike price lower that $100 is “out of the money” and will be worthless because there is no value in owning the right to put the stock to someone at $99.50 or less, if XYZ is worth $100 or more in the open market.

To get paid every Friday, we want to sell “out of the money” put options early in the week while they still have some time value, and let them expire worthless so we keep all the money we made selling the put option. I’ll give you two examples.

The first example will help you understand how the parts work together and the principals and concepts involved. The weekly options strategy is a credit spread. There are many ways to use it. There are as many ways to use this strategy as you can imagine.

But here’s the thing, it’s not what strategy you use, but rather how you use the strategy. I have discovered a low-risk way to use weekly options to get rich slowly using time decay, and this is how to do it step-by-step.

  1. Before you trade, you always put your fingers on the pulse of the market. The reason is because my research proves you can increase the odds of success on any trade by 85% simply by trading in the same direction as the broad market. If the broad market is even slightly bullish, you use the bull spread strategy, if it’s bearish, I use the same strategy in reverse (called the bear strategy.)
  2. Next, focus on the right stock, not the options. In a bullish market, you start with a stock that has available weekly options, is in an uptrend, and has a little volatility. Conversely, in a bear market, you start with a stock that is already trending down and has a little volatility.
  3. The next step is to have an “exit strategy.” Always know how and when to get out if the trade goes bad. We can “automate” the entire exit strategy with a few conditional orders. Now you have checked the market. You have found a stock trending in the same direction and you have an exit strategy to apply after you get in the trade.

Let’s assume the market is bullish. The next step would be to find a stock that is more bullish than the broad market. The next step is to find a put option on the stock you can sell at a strike price that is lower than where the stock price will drop to in the next four days

You sell a put option against that stock to bring in cash, and, at the same time, buy a lower strike priced put as a hedge. A lot of people ask me, “Why buy the lower strike-priced put as a hedge, why not just sell naked puts?”

There are three reasons to buy the lower strike priced put as a hedge

  1. This is a biggie. The reason to buy the lower strike-priced put as a hedge is: it lowers the capital required to do the trade. If you sell puts naked, you’re required to have 50% to 100% of the price of the underlying stock in cash in your account. By buying the lower strike-priced put, it lowers the capital required to do the trade.

    The capital required now is limited to the difference in strike prices of the two put options times the number of options contracts involved. So where a trade that involved selling naked puts would require $250,000 in cash in your account, you can do a hedged trade for $2,500 or even $250.

  2. Buying the lower strike-priced put as a hedge limits your risk. This way, instead of having to place $250,000 up front to do the trade and risk 100% of it, you can take less risk when we buy the lower strike-priced put as a hedge.
  3. Buying the lower strike priced put as a hedge gives us a chance to make 200% to 300% if we’re wrong about the stock. If the stock does drop an abnormal amount, we can buy back the short put and stay long the lower strike-priced put, which will skyrocket in value if the stock drops. This is how we make a huge gain, but only if we’re wrong. (More on this later.)

Let’s move on.

Here’s how you make money with these two options.

We sell a put and buy a lower strike-priced put. We get more for the put we sold than we spend on the lower strike-priced put that we buy, and the difference is called a net credit.

The net credit is our profit.

Here’s an example to help you grasp the principals and concepts. Let’s say ABC is trending higher. And let’s say it trades at $100 per share. On Tuesday, you sell the ABC weekly $90 strike-priced put and buy the ABC weekly $85 put as a hedge.

When you sell the ABC weekly $90 strike-priced put, you bring in cash. Let’s say you sold the ABC $90 put for $1.00. You sold someone the right to “put” the stock to you at $90 until Friday. This won’t happen as long as ABC stays above $90 through Friday’s close.

At the same time you sell the ABC $90 put, you will also buy the ABC weekly $85 put as a hedge. This dramatically lowers the capital required to do the trade and limits your risk. Let’s say you spend .50 buying the ABC weekly $85 put.

OK, at this point you sold the ABC $90 put for $1.00. You bought the ABC $85 put for .50, so your net credit is .50. In this case, the difference in strike prices is $5.00, and let’s say you used 10 contracts. Your capital required is $5,000 and your credit is $500.

That’s a 10% return in one week!

In this case, ABC is at $100. If ABC stays above $90 through Friday’s close, you will make $500 or 10% for the week on this trade. If the stock goes up, you win. If the stock goes sideways, you win. If the stock goes down, you can still win. As long as it stays above $90, you win. If ABC drops below $90, you will lose some or all your net credit and some or all of your $5,000 capital required to do the trade.

To avoid that, you can get out of this trade anytime, even before ABC drops below $90, so you have total control. The best way to avoid a loss is to use stocks that are already trending higher and going deep out of the money, below the stock’s current price, so you have some “cushion” in case the stock drops.

OK, let’s have a quick review.

My 7 Simple Steps to Weekly Options Profits…

Step 1: Get the list of stocks that have available weekly options.

Step 2: Pick a couple of stocks you’re at least somewhat familiar with.

Step 3: Look at a six-month chart on each of the stocks you’ve chosen. What you want to do is determine—as best as you can—the pre-existing trend of the stock. For example, if the broad market’s trend is up and the stock’s pre-existing trend is up and looks good… then, and only then, do I take a look at the stock’s weekly options to see if there is a potential trade.

If you want, you can use some “trend criteria” to help you see the trend.

This trend criteria can be anything you want that helps you identify the underlying stock’s current trend, because the current trend of the underlying stock is critical. Some people use moving averages, but you can use whatever you’re comfortable with. When you find a stock that is in a nicely rising trend and you can clearly see support, then picking the options becomes easier.

Step 4: After you find an appropriate stock, look at strike prices that are below the current stock’s price, at a level that the stock is not likely to hit in the next week. You can base this on the “average true range” of the stock—or however else you’d like to.

Step 5: Next, go online and look at the live, weekly put options quotes. Look for a spread between two put options that have strike prices that are below the current stock’s price and support levels.

Also look for a specific difference in options prices to create a net income by getting more for the put you sold than the put you paid for.

Step 6: Enter your order using a “limit order” and apply your exit strategy at the same time.

Step 7: Sit back, relax, and let time pass, as it always does. One week later, both options will expire and the “net credit” you took in can be transferred into your wallet— or you can leave it in your account. It’s up to you!

This is the #1 way to make weekly income with options.

THE SPECIAL OFFER

Here’s something that may help you even more. I’m giving a free webinar all about this strategy. You can register to attend the webinar on this page -

Let me Show you My Full System for Weekly Income

ABOUT THE AUTHOR

Jack Carter began his trading career as a Wall Street trained stockbroker in 1984. He later founded Superior Information, a company focused on publishing opinionated stock and options information for traders and investors, in 1997.

Throughout his career he has also been a Nasdaq Market Maker and a “fast money” trader. Jack Carter is also known as a top consultant. He has customers and clients on every continent and regularly consults with traders and individual investors. His company now has a team of contributors and top traders serving stock and options traders and investors with their own stock and options trading services.

Chapter
02

How to Retire in 5 Years or Less on $13,000 per Month,
Tax Free

By Peter Schultz, Cashflow Heaven Publishing

Retiring in five years or less on $13,000 per month, tax-free is a pretty compelling idea—but is it possible? At Cashflow Heaven, that’s exactly what we teach. Our goal is to show you how to safely and effectively generate cash flow from the stock market, completely tax-free. Once you learn how to do that, you can literally create an income—perhaps even enough to become financially free—from anywhere in the world you can find an Internet connection.

Now as appealing as that sounds, you are going to need a good strategy to make it happen. The strategy needs to be safe and work consistently so you can depend on it while still providing extraordinary returns. The truth is $13,000 per month is a pretty tall order.

And it’s an especially daunting task to try and generate that income the way most people do it. If you’ve met with a professional financial advisor, you know it can be a pretty sobering experience. For example if you want to generate $13,000 per month it comes to $156,000 per year ($13,000 per month x 12 months).

Conventional Investing for Retirement Requires a Lot of Money—Maybe Too Much Money

At conventional interest rates, you are going to need a lot of money to generate that level of income—maybe more than you have. For example, the interest rate on the 10-year Treasury bond is hovering below 2%--and the dividend yield on the S&P 500 is also around 2%.

So at an annual rate of return of 2% you are going to need $7,800,000 to generate $156,000 per year. That's a huge amount of money. If you've got almost eight million dollars, congratulations. However you don't have to be good at demographics or statistics to know that most don't. If you're dealing with somewhat less than that, you need to get far better than conventional returns.

Now maybe you're already a savvy investor—maybe you’re in some higher-paying dividend stocks that generate 5% per year—the upper limit of typical dividend stocks. But even at 5% you're going to need over $3 million to generate $13,000 per month. As you can see, at today's returns and interest rates, you need a tremendous amount of money to create a really good income.

You don’t need to get hung up on the $13,000 per month figure--maybe you don't need that much money, maybe you need a lot less. We're just using that as an example because that's an amount most people can live on pretty comfortably--if you keep your trips to Starbucks to a minimum!

To Retire in Style, We Need Substantially Better Returns

To reach our goal, we need to get substantially better returns than what the conventional strategies offer. Most people have mutual funds along with some dividend stocks, but are understandably dissatisfied with their returns and want to do better.

You may be an individual who's really investigated trading and perhaps doing a lot of trading right now. Some people are even day trading. The problem with active trading is you can get mixed results. Many traders I’ve spoken with go one step forward and two steps backward. You can have losses, and it can be pretty stressful. Oftentimes the market throws some pretty frustrating curve balls.

So even if you are an active trader and enjoy it, take a look at this method because it's a way to generate excellent and frequent cashflow that tends to grow your account faster than any other strategy I’ve seen—and the best news is you don't have to worry so much. If you're an active trader, that alone is going to be a refreshing change. In the world of investments, however, there's always uncertainty, and if you've been trading, you know that. We need as much going for us as possible, and this plan has a mathematical probability of winning that is greater than 80% on every trade you place.

The trick with any investing is to try and get the greatest amount of return possible for the lowest amount of risk. And that's what this strategy provides—high probability and high returns. Most investment advisors tell you that’s impossible—to get high returns you must take on higher risk—but that’s not true if you have a strategy that provides an overwhelming mathematical edge.

To Make Bigger Safer ReturnsGet a Nobel-Prize-Winning Formula Working for You

So how do you engineer high returns and a high probability of winning? We're basing our expectations on a formula that is so remarkable it won the Nobel Prize back in 1997 for the mathematicians that discovered it.

The formula was actually developed back in the early 70s, and it made standardized options and the modern options market possible back in 1973. That formula is called the Black-Scholes Options Pricing Model—and here’s what it looks like:

Now, if you are thinking that looks really complicated and wondering how are you going to figure it out--don’t worry—you don’t have to. The good news is you don't need to know all the complex workings of the internal combustion engine to drive your car to the bank—and it’s the same idea here. You just need to know enough to take advantage of it.

We’re going to use this formula to stack the odds in our favor, and to set up a mathematical expectation of winning the majority of the time. The key to using this formula to our advantage is to be selling options instead of buying them.

This gets into a really interesting area of psychology. Most options traders are buying options for one simple reason--they are looking for a home run. They want to double or triple their money in a very short amount of time. And the truth is, if you buy options, you will get some big winners.

But there’s a problem with that approach. If you talk to a lot of options traders, they’ll typically tell you things were going really good for a while, and then all of a sudden they blew up their account. They lost all their money.

A funny thing happens in the stock market: sometimes the things that you think are going to happen, don't. You get surprises. The market turns around. It reverses. The Fed makes a certain announcement. The company that you're betting on comes out with a warning, or whatever. Whatever you thought was going to happen didn't--and that’s what makes options buyers go broke.

How to Jump on the Right Side of Options Trading

When you become an option seller you are on the opposite side of that trade, so the odds jump considerably in your favor.  A lot of surprises can happen and you can still make money. That's what I love about selling options. I've been an options trader for a long time now and I still occasionally buy an option when there's a really good setup—but the vast majority of the time I’m selling options because the odds are so stacked in your favor you can actually screw up and still come out okay.

When we talk about selling options, we’re not talking about covered calls or selling naked. The strategy I’m talking about is selling credit spreads. When you sell a credit spread, you immediately take in money, and it's pretty inspiring to see that cash hit your account right off the bat.

What is a Credit Spread?

A credit spread is simply selling an option and then buying another option to hedge. The option we're selling is more valuable than the one we're buying so it creates a credit in our account. A credit is money that you can use for anything you want—to buy the things you need, or to build up in your account for even great profits.

So How Do We Sell a Credit Spread for Immediate Cash?

Let’s take a look. In the chart below you can see the stock going up and down, but it’s in a general uptrend. What we want to do is sell an option strike that's likely never going to get touched by the stock.  

The stock is up at 107 and we’re going to sell a put option down at 99 and we're also going to buy another option as a hedge below it at 98. That limits our risk to just the distance between them, and in this case, that's just a dollar.

We're selling the 99 puts for 30 cents and buying the 98 puts for 23 cents and as you can see, there's a finish line on October 28. So in this case we’ve got about three weeks until expiration. One of the beauties of this strategy is you always know where your finish line is. At some point, in the not too distant future, these options are going to cease to exist. And if that time comes and the stock isn’t below 99—then both options expire worthless. And if you sell these spreads correctly, that’s exactly what happens the vast majority of the time.

If you ask speculative options buyers how they lost money, they’ll almost always tell you their option ran out of time before the stock could move in their direction. When that happens, the options seller is the one who makes the money. That’s who wins the majority of the time, and that’s who we want to be.

So What Can You Make on This Trade?

If we sell the 99 puts for .30 and buy the 98 puts for .23 we collect a net of .07 cents on that trade—or $700 for 100 contracts. To figure out our rate of return, we divide that .07 credit by our possible loss. The maximum that you can lose is the distance between the strikes, in this case, that's $1 but we've already taken in seven cents so the maximum we can lose is 93 cents. If we divide seven cents by 93 cents, it comes to a 7.5% return before commissions. For three weeks of time, that's 2-1/2% per week. If you get out your calculator and figure out what 2 ½% per week adds up to over time, you could become extremely rich trading this strategy.

These returns can pile up on themselves pretty quickly. It's like the old compounding illustration with the chessboard where you take a penny and put it on square one and you go to the next square and double it and go to the next square then double that, and then keep doing that for the rest of the squares on the board.

That's the way these compounding returns work—you make money on the money you just made. We get some pretty decent returns, so keep in mind, people are hoping to make 2% or 3% on their money for a year with bonds and regular dividend stocks. We're talking about making 7.5% in just three weeks!

These Returns Can Get Pretty Exciting—but It Gets Even Better…

You can also go above the stock and do the same thing with a call spread and take in another 7.5%. Now we're up to 15% for that same three weeks of time. We've got lots of room for the stock to move, but not a lot of time to do it, so you tend to win on these trades the majority of the time.

If you have a stock that's going up, you want to sell put spreads. If you have a stock that's going down, you want to sell call spreads. But oftentimes the stock is moving up and down within a range so we can sell both spreads, collect a double return, and have that stock stay within the range we’ve defined with both expiring worthless.

When we sell both call spreads and put spreads on the same stock, they are called ‘wings,’ and the whole trade is called an Iron Condor.

You can see how forgiving these trades are because we're staying away from the stock price and giving the stock room to move. The stock can go up a little bit, it can go down a little bit, it can waver all around and you still end up winning.

That Sounds Good, but How Do You Know What Your Chances of Winning Are?

You can look at the above trade and think the chances of winning are pretty good—but how do you know? Well, one of the neat things about options is that they are based on a mathematical formula. So whenever we want to sell an option, we can instantly see what the odds are that will expire worthless. That's one of the really cool advantages of this strategy—I don't know anywhere else you can do that.

Our favorite broker for this strategy is Thinkorswim, because they have such good analytical tools, and such a great trading platform. Fortunately, with a little guidance, their platform is not hard to use—in fact, I'll show you a little bit of it right here:

This is the trading platform at thinkorswim, and if you look at the column on the far right, you’ll see a heading that says ‘Prob OTM’—that means ‘Probability of being Out of the Money’. In other words, it tells you the exact mathematical probability of this trade winning—because if the sold strike expires out of the money, the options seller wins.

One of the red arrows on the platform above points to the 98 strike price and the other points to the 99 strike price. We want to focus on the 99 strike price because that’s the one we sold. If we follow the red arrow all the way over to the far right column, we’ll see that the probability of this strike expiring out-of-the-money is 88.96%—so those are our odds of winning--which is pretty high.

It’s interesting that these probabilities actually do tend to play out over the long run, which makes your odds of winning close to nine out of 10 trades.  Which is fantastic, but even on the trades that become threatened, there are things we can do to fix them when they do go against us.

Trade with Confidence Knowing You Can Fix Trades that Aren’t Working Out

We call these little fixes “adjustments” and they give you a second chance to win if the trade doesn’t work out the first time. Everybody's always very interested in adjustments because they give you a kind of “get out of jail free card” where you can fix those one out of 10 or two out of 10 trades that aren’t working out.

Knowing how to adjust gives you a lot of confidence, which is important if you are trying to use this strategy to retire.

I know it sounds crazy, but sometimes I welcome a trade that needs to be adjusted because it says 2 things:

Number 1, We're selling close enough to the underlying to have to adjust once in a while. “Selling close” means we're bringing in more money. In other words, we're right at that edge where we're bringing in the maximum amount of dollars and still trying to minimize our risk. When you do that, when you sell a little closer to the underlying, once in a while you're going to have to adjust, but that's okay because we have some great ways of doing that.

Number 2, We have the means to adjust our way out of almost any situation. That makes you feel pretty darn confident in trading this way. Now I just want to be clear upfront, it is possible to lose trading credit spreads. The market can do crazy things, so it’s good to know that even in a worst-case scenario, the amount you can lose is absolutely limited—that’s why we buy that hedge option to limit our risk. But in any normal market situation, even if your spread is over-run, we've got ways to adjust out of it to make the trade better.

So the vast majority of the time, you can expect to win using this strategy, but it’s important to understand there is risk in trading—but we’re going to be stacking the odds in your favor as far as we possibly can.

Sounds Good. But is Anyone Actually Doing This Successfully in the Real World?

Yes—lots of people are quietly cashflowing the markets using this strategy with great success. But nobody talks about it because everyone wants to sell you on the idea of making lottery-size profits buying options. But once you figure out what’s really going on, you’ll realize the real money is being made by the lottery ticket sellers.

We’ve been showing people how to sell credit spreads successfully since 2010, and we’ve got a lot of people that are real believers—they tell us with great conviction they wouldn’t trade any other way.

I want to share an email I got from one of our subscribers. I just absolutely love this guy’s attitude—his name is Bob Milota. He's the kind of guy that really gets the strategy. He’s a retired engineer so he understands numbers and probabilities—Bob is a smart guy.

After doing lots of different kinds of trading, he decided that this is all he wants to do now. This is what Bob says: "As promised, here are my trading results for the year. I very nearly had an undefeated season in my high probability credit spread trading this year. Unfortunately, I suffered my first loss for the year a week ago. My record so far for the year is, 13 put ratio spreads, all done for a credit. I traded eight iron condors, two of which consisted of three credit spreads because I closed the winning-est side and rolled in. Plus five single credit spreads, one of which is the above-mentioned loss.”

That amounts to 25 wins and one loss, which is a 96% success rate.” He goes on to say, "I made a total of $19,126 making $1,594 per month and averaging a return of 9.5% per month, including all commissions and losses."

That's pretty wonderful for Bob and those like him. I know people that are taking second jobs to make an extra $500 a month—but Bob, with a few mouse clicks, is making far more. Plus he says it’s kind of fun--and I agree. He says it keeps him sharp and it keeps him interested. He's making about $1,600 per month and that amount is constantly increasing. And we've got people that are doing a lot better than that.

So the returns are there and your probability of winning is high—but can we do even better?

Building Up Your Account Quickly and Consistently is a Big Benefit—but How Can We Do It Tax Free?

There is a special account where we can trade these credit spreads so that they can potentially build to infinity without having to pay ANY tax on the profits…Ever!

This special account is called a Roth IRA.

This kind of an IRA has some special advantages that make it perfect for trading high-probability credit spreads. Here the characteristics of a Roth:

  • Contributions are not tax deductible—however…
  • You can contribute up to $5500 per year under age 50, and $6500 over age 50.
  • Direct contributions to a Roth IRA may be withdrawn tax free at any time.
  • Earnings may be withdrawn tax free and penalty free after age 59-½.
  • Distributions from a Roth IRA do not increase your Adjusted Gross Income, so these earnings do not increase your tax bracket on your other income.
  • The Roth IRA does not require distributions based on age. All other tax-deferred retirement plans require withdrawals by 70½.
  • Unlike distributions from a regular IRA, qualified Roth distributions do not affect the calculation of taxable social security benefits.
  • Assets in a Roth IRA can be passed on to heirs.
  • Single filers can make up to $110,000 to qualify for a full contribution and can make $110,000 to$125,000 to be eligible for a partial contribution.
  • Joint filers can make up to $173,000 to qualify for a full contribution and $173,000–$183,000 to be eligible for a partial contribution.

As you probably noted from the list above, the most compelling characteristic of a Roth is that you can build up any amount of wealth in the account--and as long the distributions are taken after the age of 59-½, the money you take out is Completely Tax Free.

Combine that huge advantage with a strategy that consistently makes money, and you’ve got a blueprint to create a comfortable retirement no matter where you are at now.

So Your Odds of Winning are Excellent—And Now You Have a Way to Build Up Those Profits Tax Free—But How Much Can We Expect to Make?

We typically shoot for 15% to 25% returns for just two weeks of time. But it’s important to realize you want to hold back about a third of your account in cash for buy-backs and adjustments, so you’re not getting those returns on the whole account. Plus, in spite of our best efforts there will be losing trades—that’s how trading works, so we have to factor those in.

Trading this strategy with our probability of winning typically returns about 20% every two weeks. Now if you are a speculative trader that might not sound like much—but it is when you consider your win ratio. If you are consistently making that kind of money every two weeks, you are going to be very wealthy within just a few years.

But let’s say you’re a little skeptical about those returns. Let’s say that in the real world something always happens, and our theoretical rate of return doesn’t quite materialize.

Let’s say that all you can generate is just 5% per month—not 20% every two weeks, but just 5% per month—that’s about a quarter of what we can mathematically expect even factoring in losses and holding a portion of the account in cash.

If the maximum we can put into a Roth is $6,500 per year—and we faithfully put that in every year—what does your account turn into at “just” 5% per month? Here’s what your account looks like if you invest $6,500 per year and get 5% per month over a five-year period:

As you can see from the chart above, by year two you are making approximately what Bob is making now—but by year five you are making an inspiring $12,965 per month—and the very next month that grows to $13,613 and the income grows even more steeply after that.

Now I realize the real world is different than the calculator world—sometimes you’ll be better per month and sometimes you’ll do worse—but what if you even come close?

Even at these modest projections at the end of year 5 your account has grown to over a quarter of a million dollars! At that point, you can start living off some of your profits and still see your account grow. And the inspiring thing is all it took was an investment of $6,500 per year—an amount most people can save or already have.

Which means you probably aren’t more than five years away from a comfortable retirement—and maybe sooner if you monthly needs are less---all you need is a little know-how to make it work.

I’ve put together a complete presentation on how to trade this strategy. You’ll see our favorite way to adjust a spread if it is moving against you so you’ll never have to worry about stock reversals. I will also show you more actual examples of how to set up your trades so you really get the concept.

Plus, I’ll introduce you to others that are trading this way, including my cousin Ralph out in Chicago, and a lady that is managing a fund making millions of dollars per year selling options. So you’ll be able to see this concept works no matter how big your account gets.

And I’ll you’ll see the proof—you’ll get a link to interviews with her where you can see for yourself what she’s doing. I guarantee that you’ll come away inspired.

I believe so strongly that this strategy can make a beneficial change in your financial situation that I want you to access this special presentation for free. It’s only about 60 minutes, but it could change your life.

Once you register, I’ll also send you our Tuesday night updates so you can see for yourself how these trades work in the real world.

SEE THE PRESENTATION

CLICK HERE to sign up for the complete presentation. You’ll be able to control the presentation with forward and back controls and a pause button so you can take it all in at your own speed—and even take notes if you like.

And once you see this concept, if you have questions you can call our office toll free at 1 877 507-7878, or email us at customerservice@cashflowheaven.com.

I truly believe that anyone who follows my instructions can make money trading this way—even if you’ve had little success trading in the past. If you watch just five minutes, I suspect you’ll be watching the whole thing—in fact you might even have a little trouble sleeping because the math and probabilities are so compelling—even starting with a fairly small account.

THE SPECIAL OFFER

So once again, CLICK HERE and I look forward to showing you a little-known but amazingly effective way to create a level of cash flow that makes it more possible than ever to retire on your own terms.

Keep up the good work, and I’ll look forward to seeing you inside the presentation,

Peter

ABOUT THE AUTHOR

Peter Schultz has been showing self-directed investors how to trade successfully since 1996, and is a nationally known speaker on options trading, the author of Passage to Freedom, The Options Success Trading Package, The Winning Secret Trading Package, The Explosive Profits Package and The Greatest Options Strategies on Earth. He has also written several important short reports on innovative options techniques, and is a popular guest on radio and television talk shows pertaining to trading and the financial markets.

Fascinated by the idea of asset-produced monthly income, Peter founded Cashflow Heaven Publishing in 1999 to help people obtain a better lifestyle through trading and investing strategies designed to produce exceptional monthly returns.

Peter graduated in 1982 from Southern Oregon University with a Bachelor of Science degree in Business with marketing and finance concentrations. He is happily married with three children and makes his home in Ashland, Oregon...“on the eastern shores of Bear Creek somewhere north of Siskiyou Pass.”

Chapter
03

Harnessing Volatility for Income

By Steve Smith, YoloPub.com

In the month since July 12 when the S&P 500 Index finally pushed to a new all-time the index has been essentially sideways causing both real and implied volatility readings to drop to historically low levels.  This volatility crush presents a significant challenge to option traders looking to generate income.

But one instrument that can be harnessed to deliver reasonable returns over time are those related to market volatility itself; namely VIX related options.

Before getting to the specific strategies a little background on the nature and nuances of these products are in order to make sure we understand statistics and structure the drive the behavior of securities and options tied to implied volatility.

The Chicago Board of Options Exchange created the its VIX Index back in 1992 as a means of measuring the 30-day implied volatility of options on the S&P 500 Index.  The goal being to provide a snapshot of how much people were willing to pay for options as an expression of expected price movement of the broad market.  It quickly was given the “fear gauge” moniker given VIX tends to rise during market sell-offs as investors are willing to pay higher premiums to protect their portfolios during sell-offs.

But it wasn’t until 2004 when futures contracts based on the index was launched that one could actually trade the well-known Futures were subsequently followed in 2009 by Exchange Traded Notes such as iPath S&P 500 VIX Short-Term (VXX) and the Velocity Shares 2x VIX Short Term (TVIX) and their related options.

The timing was of the 2009 launch was both fortuitous and unfortunate.  The former for exchanges such the CBOE and issuers such as Barclay’s as this new “asset class” for hedging have become wildly successful in terms popularity, assets under management and trading volume. 

But for uninformed investors that thought they could own these as long term hedge VIX related ETPs have been an unmitigated disaster.  

For example, the VXX has declined by 99.6% since inception as its shares, which have undergone five 4:1 reverse splits, have sunk from $32,000 to the current $36 on a split adjusted basis.  That’s some $5 billion in value that’s been vaporized.

Statistics and Structure

As we’ll see these can be tricky to trade, and are best used for shorter time frames.  Basically; VXX is a chimeric creature; it’s structured like a bond, trades like a stock, follows VIX futures, and decays like an option.  But once understand some of the basic concepts they can be used for fairly predictable profits.

Some important points:

  • The VIX is mean reverting statistic. Its 20-year mean is 18.8.
  • The VIX “cash” Index cannot be traded directly.
  • The daily change in VIX has had a -0.76 correlation to the daily change in SPY since Jan. 30, 2009. Meaning every $1 change in the SPY the VIX will move inversely by approximately 0.75.
  • On average VXX moves only 55% as much as the VIX index.
  • The VXX will loss at the average rate of 4% per month (30% per year) Ceteris paribus. All else being equal.

This last item, that is the downward drift is in the value of VXX, is what we want to focus on for harnessing profits in trading its options.  

The VXX’s goal is to maintain a 30-day measure of implied volatility. Since it can’t own “cash” VIX is constructed through the purchase of futures contracts.  It uses a balance of the front two month contracts.  Each day it must be rebalanced, that is sell some of the front month and buy some of the second month to maintain the 30-day weighting. This is where it gets good.

Cantango Towards Zero

The term structure in normal volatility environments one in which later dates trade at a premium or higher prices.  This is known as contango and comes from the notion that given a longer period of time the higher the probability of large price change or increase in volatility. 

A normal cantango term structure can be seen here:

Under these circumstances VXX suffers from negative roll yield when the CBOE VIX futures curve is in contango. Each day the VXX Fund must “roll” its futures to rebalance to the later contract and as the expiration date nears, it is forced to sell its closest to expiry contracts and buy the next dated contracts. The purchases are often at higher prices if the curve is in contango, thus losing the spread amount between the two contracts that are rebalancing.

There are some periods when volatility spikes higher and the near term futures will trade at the premium to the later dates on the; this is known as ‘backwardation.’ It is based on the notion that at some point in the future volatility will subside back to normal levels. Again, the concept of VIX being mean reverting.  

During the financial crisis the VIX hit extreme levels and the futures went into steep backwardation as can be seen below.

Even in the above backwardation in which the near term futures are now at a premium there is downward pressure on the futures as must ultimately converge towards the “cash” VIX which in this instance trade at a discount.  

During the financial crisis the VIX futures remained in backwardation for an extended period of nearly 8 months, but typically these spells are much shorter and usually last just a few days to a week or two. Again, the notion being that eventually VIX reverts to its mean near the 20 level.

So, even though the rates of decay in the VXX can vary depending on the overall movement of the SPY and the term structure of the VIX futures, it definitely heads lower over time. The chart below give a graphical history of their decay rates. Each data point is computed using the cumulative gain or loss over the previous six months and a monthly compounding period.  None of these ETPs existed before 2009 (the first one, VXX started in January 2009), so the data prior are based on a model from the CBOE.

Trade One: Catch the Drift

Now, given the above one might ask, “why can’t I just short the VXX or sell calls, sit back and watch them go down?”

The issue is when volatility spikes in volatility, which it does inevitably and unexpectedly 3-4 times a year, the move tend to be vicious with 30%-50% increases within a matter of days out not out of the ordinary. 

That might work for an institution that can do some sophisticated multi-market hedging or a deep pocketed investor with a high risk tolerance who could ride out the pain but for most of us such a move could a create a loss wiping out several expiration cycles of gains.

What if use a spread to limit risk? We are not the first to think this way and the option prices reflect the known risks and pricing behavior. The problem here is the drag of cantango decay is well known and fairly well priced into the options.

For example,with the VXX trading $37.30 the 38/40 call spread (1.8% out-of-the-money)  and $2 wide between strikes with 30 day’s until expiration would be worth approximately $0.50. 

Conversely a similar vertical put spread, the 34/36 put Spread (3.4% out-of-the-money) trades at $1.00 or double the value despite it being even further out of the money.

The conclusion being this “Decay Premium” is priced in and generally speaking basic vertical spreads are not the most efficient way to make a bearish speculation.

My approach is to use a butterfly spread as a lower cost, higher reward way to target the expected drift lower. 

  • A standard butterfly spread uses a 1x2x1 construction.
  • On a long butterfly you buy the outside or “wings” and sell the middle strike or “body.”
  • The maximum profit is realized if shares of the underlying at the middle strike on expiration.

Based on the knowledge the VXX can be expected drift approximately 4%-5% lower per month all else being equal I want to target the $33 level (a 10% decline from the current) in 60 days. 

In mid-August with the VXX trading around $37.30 the specific trade would look like:

-Buy 10 contracts October 36 Put

-Sell 20 contracts October 33 Put

-Buy 10 contracts October 30 Put

For a $0.35 Net Debit or $350 for the 10x20x10 contract position.

As you can see from the risk graph below the maximum loss is the cost ($350) and would be incurred if VXX is above $36 or below $30 at the October expiration.

The maximum profit is $2,650 and would be realized if shares are at $33 on expiration.

The presents us with a very attractive 7.5x profit to risk ratio.

Now, it is unlikely VXX will be exactly at $33 on expiration but given the known downward directional bias there is a high probability that it be within the profit zone of $30.40 and $35.70.

And given the attractive risk/reward profile this a strategy when can repeat on a three to four week expiration cycle on the expectation that over time the downward drift of the VXX will land you in the profit zone more often than not.

Trade Two: Mean Reverting Trade: Sell Call Spreads

My other approach is based on the concept volatility is mean reverting and that spikes higher will be relatively short lived. 

It needs to applied on a very selective basis only when a certain set of criteria are met.  Namely:

  • The VIX has climbed at least 35% within the past 5 trading sessions
  • The VIX is above 25% level
  • Implied volatility of the VIX or VXX options is above the 95% level.

As you can see these criteria often coincide and typically only occur 3-4 times a year.

If the above situation presents itself then:

Sell a call credit spread in which:

  • The lower strike sold is at least 10% out-of-the-money.
  • Two -three weeks until expiration.
  • The Net Credit is at least 30% of the width between strikes (ie $0.30 per $1.00 wide).

Over the last 20 occurrences in when the above criteria have been met this strategy has delivered the maximum profit 19 times.  The lone loss was incurred during the September, 2011 when the sequestration led to a government shutdown. .

Trading volatility products can be tricky but if armed with the knowledge of how the price and products behave can be profitable when the appropriate strategies are applied.

THE SPECIAL OFFER

Learn How to Trade Options Simply, Effectively and Profitably

  • Stop wasting time using bad methods for finding trades. Put that time back into the enjoyment of your life
  • A trick to get rid of low probability trades will make you more successful
  • The one key component you need to be more profitable no matter what you trade.

GET STEVE’S FREE REPORT HERE!

ABOUT THE AUTHOR

Steve Smith is an expert options trader with 25 years’ experience in the markets.

Steve was a seat-holder of the Chicago Board of Trade (CBOT) and the Chicago Board Option Exchange (CBOE) from 1989 to 1997. He joined YOLO publishing in 2013 and is currently the editor of The Option Specialist and runs the 20K Portfolio Program, which provides all types of options trades for all types of traders.

Chapter
04

The 4 Step Trading Process

By Sean Kozak, GoldenZoneTrading.com

In the following video Sean Kozak, founder and head trader at the Golden Zone Trading, walks you through his 4-step trading process during a recent live trade.  We use this process to help deal with market volatility while trading a rules based strategy.  We’ve outlined the play-by-play explanation of each step below for your convenience.

#1. Identify Directional Bias

When entering into a trade, you will first need to assess the direction of the market.  We encourage all of our traders to trade WITH the markets instead of against it, as we find this makes trading much simpler.  We assess market structure, order flow and volume while using scanners to identify sentiment prior to trading.  Keep in mind, we avoid trading into news at all costs, as this poses unhealthy trading climates.

#2.  Determine Trade Setup

Once you’ve determined the direction of the market, you’ll want to identify your entry point for the trade.  Whether buying in demand or selling in supply, it's all relative to our directional bias determined in step #1.  It's important to have a variety of setups to choose from, so that you can adjust the trade choice based on market conditions.  We implement various trades that can be used on both trending an oscillating markets.

#3.  Planning the Trade

Planning the trade involves mapping out several aspects of the entry, exit, probabilities and qualifiers.  Prior to execution, we always approach the trade from a proactive state not a reactive state.  This makes for less emotional interference while providing a stronger trading plan for entry and exits.  Sometimes the market will allow for ample time to asses trade planning while other times we will be forced to make a quick decision.  Knowing your strategy and practicing beforehand makes for steady aim!

#4.  Trade Management

It can be argued that trade management is the most important part of any trade, because it’s the exit that gets you paid!  The management phase involves two aspects:

●     Managing the stop loss and targets for risk while attempting to lock in as much profit as possible, and

●     Managing your emotions and expectations of the trade based on what the market is actually showing you is possible at that time.

It's important to accept hitting base hits is just as important as home runs.  We will trade for small wins, large wins, breakevens as well as small losses, BUT NEVER LARGE LOSSES!

In conclusion, this 4 step trading process is the backbone to how we prepare for our trading day.  Without structure or a plan of attack it's extremely hard to trust your abilities to remain consistent.

THE MOVIE

THE SPECIAL OFFER

Join us in our live Trade Room to see how we trade every Wednesday and Thursday from 9:00 AM to 11:30 AM ET. CLICK HERE to register for your FREE GUEST PASS!

ABOUT THE AUTHOR

Sean Kozak is a global assets trader specializing in Order Flow® & volume strategies for day & swing trading. His passion & experience for the markets has influenced him to develop comprehensive software products & training programs designed to teach others his techniques and strategies.

He is the Founder/Head Trader of Golden Zone Trading whose chief aim is to provide turnkey software solutions & live market training for active traders. His success in both trading and software development, led him to work with traders globally as a mentor, strategy developer, and trading educator.

He has held positions at private trading firms, holds industry licenses and was mentored by former market makers on the CME (Chicago Mercantile Exchange) & CBOE (Chicago Board of Options Exchange) allowing him to hone his trading skills and become a respected leader & educator in the industry.

Chapter
05

Naked Put-Writing: A Strategy for All-Hours

By Lawrence G. McMillan, McMillan Asset Management

The sale of a naked put is often a very attractive strategy that is conservative, can out-perform the market, can have a high-win rate, and can be analyzed and sometimes constructed in non-market hours.  In this article, we’re going to look at some of the background on put writing, show a systematic way to select which puts are best to write, and finally explain how you can implement them into your trading arsenal “outside normal hours.” 

The methodologies described herein are ones that I have confidence in, for they have produced profitable results in actual recommendations and in trading accounts that we manage over time.  However, there may be other profitable approaches as well.  I am not maintaining that this is the only way to analyze put writes – only that this is one viable way.

Option Selling is Conservative

The basic concept of option writing is a proven investment technique that is generally considered to be conservative. It can be implemented as “covered call writing” or, alternatively, “naked put writing” which is the equivalent strategy to covered call writing.

In either case, one is selling a wasting asset, and over time the cumulative effect of this selling will add return to a portfolio, as well as reducing the volatility of a purely equity portfolio.

People sometimes stay away from uncovered put writing because they hear that it is "too risky" or that it doesn't have a sufficient risk-reward. The truth is that put selling, when secured by cash, is actually less risky than owning stock outright and can out-perform the broad market and the covered-writing index over time.

Covered Writes vs. Naked Put Sales

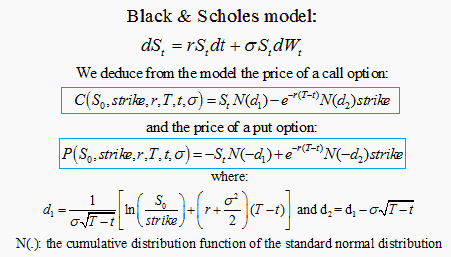
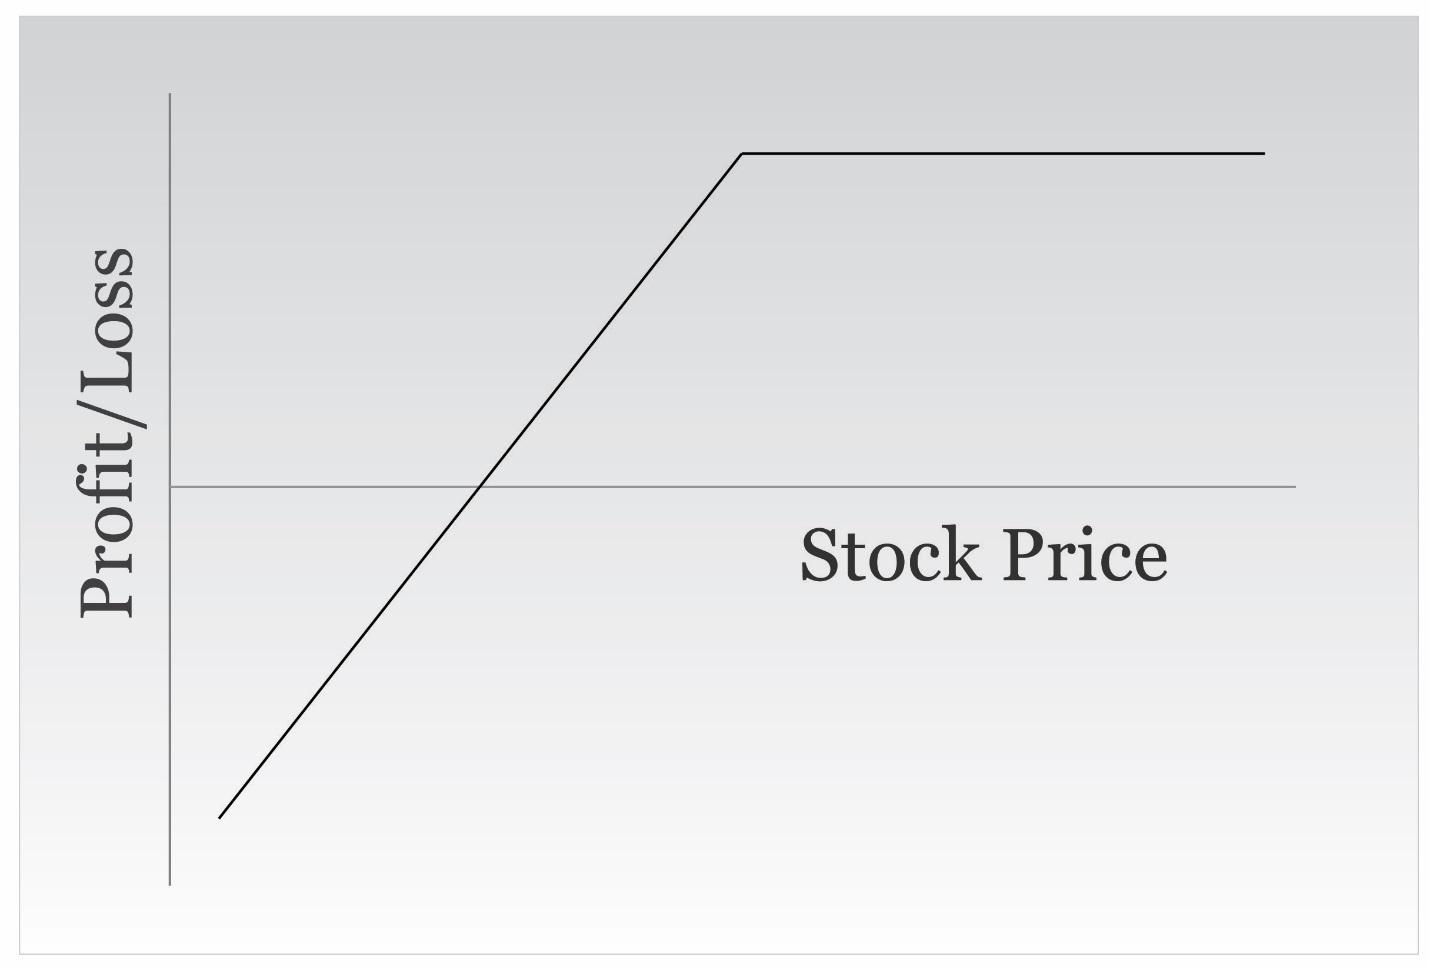
First of all, it should be understood that the two strategies – naked put writing and covered call writing – are equivalent.  Two strategies are considered equivalent when their profit graphs have the same shape (Figure 1).  In this case, both have fixed, limited upside profit potential above the striking price of the written option, and both have downside risk below the striking price of the written option.

 FIGURE 1

One very compelling, yet simple argument in favor of naked put writing is this: commission costs are lower.  A covered write entails two commissions (one for the stock, the other for the written call).  A naked put requires only one.  Furthermore, if the position attains its maximum profitability – as we would hope that it always does – there is another commission to sell the stock when it is called away.  There is no such additional commission for the naked put; it merely expires worthless.

Nowadays, commission costs are small in deeply discounted accounts, but not everyone trades with deep discount brokers.  Moreover, even there, it doesn’t hurt to save a few dollars here and there. 

So, a naked put sale will have a higher expected return than a covered call write, merely because of reduced commission costs.

Another factor in utilizing naked puts is that it is easier to take a (partial) profit if one desires.  This would normally happen with the stock well above the striking price and with a few days to a few weeks remaining before expiration.  At that time, the put is (deeply) out of the money and will generally be trading actively, with a fairly tight market.  In a covered call write, however, the call would be deeply in-the-money.  Such calls have wide markets and virtually no trading volume.

Hence, it might be easy to buy back a written put for a nickel or less, to close down a position and eliminate further risk.  But at the same time, it would be almost impossible to remove the deeply in-the-money covered call write for 5 or 10 cents over parity.

The same thinking applies to establishing the position, which we normally do with the stock well above the striking price of the written option.  In such cases, the call is in-the-money – often fairly deeply – while the put is out-of-the-money.  Thus the put market is often tighter and more liquid and might more easily be “middled” (i.e., traded between the bid and ask).  Again, this potentially improves returns.

The above facts regarding naked put writing are generally known to most investors.  However, many are writing in IRA or other retirement accounts, or they just feel more comfortable owning stock, and so they have been doing traditional covered call writing – buying stock and selling calls against it.

But it isn’t necessary, and it certainly isn’t efficient, to do so.  A cash-based account (retirement account or merely a cash account) can write naked puts, as long as one has enough cash in the account to allow for potential assignment of the written put.  Simply stated, one must have cash equal to the striking price times the number of puts sold (times $100, of course).  Technically, the put premium can be applied against that requirement.

Most brokerage firms do allow cash-based naked put writing, however, some may not.  Some firms may require that you obtain “level 2" option approval before doing so, but that is usually a simple matter of filling out some paperwork.   If your brokerage does not allow cash-based putselling, you can always move the account to one that does, like Interactive Brokers.

Once you write a naked put in a cash account, your broker will “set aside” the appropriate amount of cash.  You can’t withdraw that cash or use it to buy other securities – even money market funds. 

Most put sellers operate in a margin account, however, using some leverage (if they wish).  One of the advantages of writing naked puts on margin is that the writer can gain a fair amount of leverage and thus increase returns if he feels comfortable with the risk (as a result, we have long held that naked put writing on margin makes covered call writing on margin obsolete).   That is not the case with cash-based naked put writing, though.  The returns are more in line with traditional covered call writing.

In summary, put writing is our strategy of choice over covered call writing in most cases – whether cash-based or on margin.   Later, when we discuss index put selling, you will see that there are even greater advantages to put writing on margin.

Put-Selling Can Outperform the Market

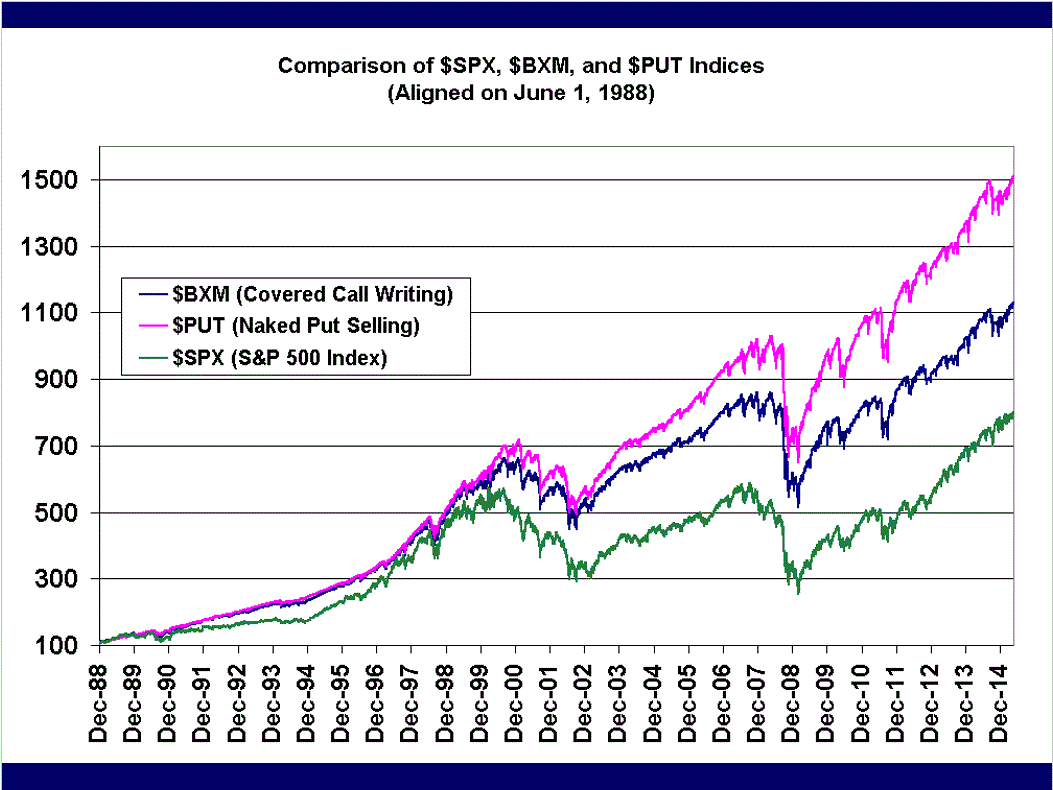
The Chicago Board Option Exchange (CBOE) has created certain benchmark indices so that investors can compare covered call writing ($BXM), naked put selling ($PUT), and the performance of the S&P 500 Index ($SPX). Figure 3 compares these indices, with all three aligned on June 1, 1988.

FIGURE 2

It is clear from the Figure 2 that naked put writing ($PUT) is the superior performer of these benchmark indices.  For this reason, naked put writing is the preferred option-writing strategy that we employ in our newsletter services. 

Since covered call writing is equivalent to naked put selling – and since Figure 2 merely shows dollars of profit, not returns – you might think that the covered call writing graph and the naked put writing graph would be quite similar.

But there is something more to index put writing – especially writing puts on the S&P 500 index ($SPX or SPY, or even e-mini S&P futures): out-of-the-money puts are far more expensive than out-of-the-money calls.

This is called a “volatility skew,” and it has been in effect since the Crash of ‘87.  Institutional put buyers want to own $SPX (and related) puts for portfolio protection, and they don’t seem to care if they constantly pay too much for them.  Conversely, other large institutions may be selling covered calls as protection, thereby depressing the prices of those calls.  Some institutions do both – buy the puts and sell the calls (a collar).  Thus, the main reason that $PUT outperforms $BXM by so much in Figure 3 is that the out-of-the-money puts being sold are far more expensive (in terms of implied volatility) than are any out-of-the-money calls being sold.

We recommend put ratio spreads and weekly option sales in The Daily Strategist newsletter as a way to take advantage of this.  Moreover, we have put together a complete strategy – called Volatility Capture – that we use in our managed accounts.

In the Volatility Capture Strategy, we blend all aspects together to produce a reduced volatility strategy that can make money in all markets (although it will not keep pace on the upside in a roaring bull market).  The primary focus of the strategy is selling $SPX puts, but there are two forms of protection in place as well.

McMillan Analysis Corp. is registered as both a Registered Investment Advisor (RIA) and as a Commodity Trading Advisor (CTA), so we are able to offer the strategy to both non-retirement and retirement accounts.

Our complete track record and other pertinent details are available by request.  For preliminary information and a summary of our track record, visit our money management web site: https://www.mcmillanasset.com. 

For more specific information, email us at the following address: info@optionstrategist.com, or call us at 800-768-1541.

Positions Can Be Hedged

One of the main arguments against put-selling is that the draw-downs can be large in severe market downturns. One way to mitigate these draw-downs would be to hedge the entire put-sale portfolio. For example, one may attempt to offset the market risk that is inherent to option writing by continually hedging with long positions in dynamic volatility-based call options as we do in our managed accounts.

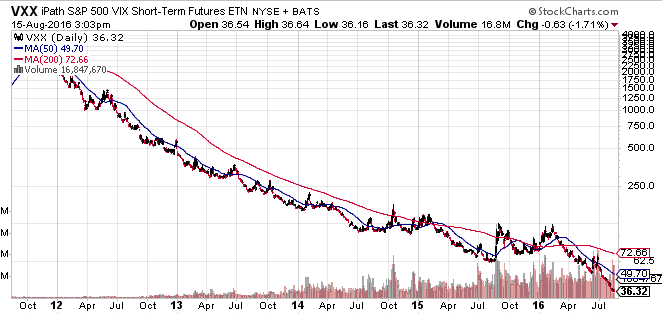
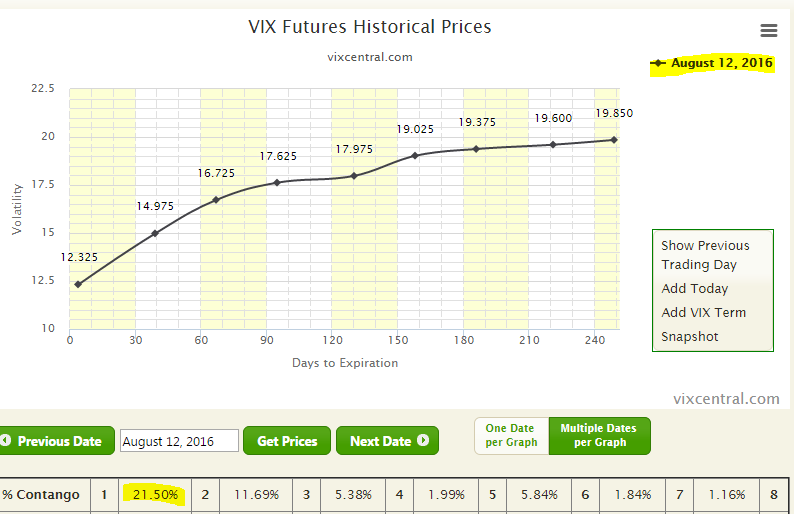
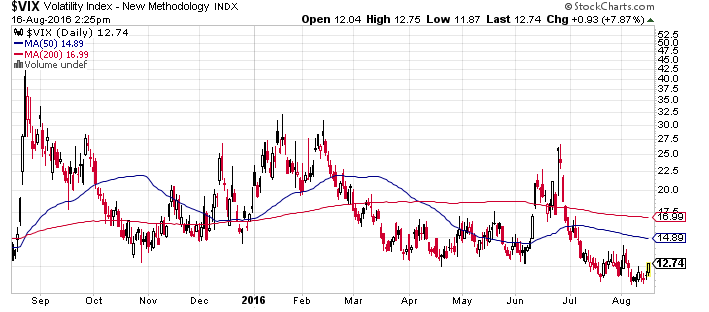
This is really a topic for another article, but the gist of this protection is to buy out-of-the-money $VIX one-month calls and roll them over monthly.  Buying longer-term $VIX calls does not work, for only the front-month contracts come anywhere close to simulating movements in $VIX (and in $SPX). 

The Odds Can Be in Your Favor

As evidenced by the $PUT Index, naked put-writing is a conservative strategy that has the potential to out-perform the broad market over time. When implemented correctly, the strategy can have high rates of success and can also be hedged against large stock market-drawdown. For example, The Daily Strategist and Option Strategist Newsletters have produced a combined 89.4% and 85.6% winners in their index and equity naked put-selling/covered-writing trades since the newsletter started recommending them in May of 2007 and April of 2004 respectively. Investors looking for put-selling trading ideas and recommendations on a daily or weekly basis may be interested in subscribing to one of those services.

Trading Outside Normal Hours

Naked put-selling is an especially attractive strategy for do-it-yourself investors who do not have time in their day to watch the markets since positions do not need to be monitored closely all day. Put-writers can sit easy so long as the underlying stock remains above the strike price of the option sold. If the stock is above the strike price at expiration, the option simply expires. The option-seller then realizes the initial credit and no closing action needs to be taken. If the position needs to be exited early, usually due to the fact that the stock has dropped below the strike price of the short option, the position can be closed out automatically via a contingent stop loss order.

You cannot trade options outside of standard stock market hours; however, depending on your brokerage, you may be able to place your opening limit order outside the stock market hours. In this case, your order would simply be placed in a queue for processing once the market opened. If your broker doesn’t allow you to place an order outside market hours, you would only need a couple of minutes during the day to either call your broker or hop on your trading software to place your trade.

Another big benefit to naked put-selling is that it doesn’t take much analysis to find good potential trading candidates. In fact, as we do for our newsletters, all of the initial analysis can be done at night with computer scans and a little bit of discretion. The following section will discuss our approach to finding naked put-sale candidates for our newsletters each night.

Choosing What Put To Sell

For the most part, we choose our put-selling positions for our various publications based on data that is available on The Strategy Zone– a subscriber area of our web site consisting of various data scans and lists of potential trades compiled by our computer analysis.  One could do the same sort of analysis yourself, as a subscriber to “the Zone.”  On top of that, our Option Workbench provides additional analytical capability for that data. 

Our computers do a lot of option theoretical analysis each night – from computer Greeks to analyzing which straddles to buy to graphs of put-call ratios.  The Zone was started about 10 years ago, when I decided to make the outputs of our nightly programs available to anyone who was interested in paying a modest amount of money to view them.  These analyses are still the basis for almost all of our recommendations. 

Expected Return

Expected return is the crux of most of these analyses.  For those of you not familiar with the concept, I will briefly explain it here.

Expected return is a logical way of analyzing diverse strategies, breaking them down to a single useful number. Expected return encompasses the volatility of the underlying instrument as a major factor.   However, it is only a theoretical number and is not really a projection of how this individual trade will do.  Rather, expected return is the return one could expect to make on a particular trade over a large number of trials.

For example, consider a fair die (i.e., one that is not “loaded”). There is an equal, one-sixth chance that any number will come up on a particular roll of the die.  But does that mean if I roll the die six times, I will get one once, two once, three once, etc.?  No, of course not.  But if I roll the fair die 6 million times I will likely have rolled very nearly 1 million ones, 1 million twos, etc. 

We are applying this same sort of theory to position analysis in the option market.

My Approach

For naked put selling, the first thing I look at is the file of the highest potential returns. These are determined strictly mathematically, using expected return analysis. This list is going to necessarily have a lot of “dangerous” stocks listed as the best covered writes.  Typically, these would be biotech stocks or other event-driven small-cap stocks.

Next, I reduce the size of the list.  I have a program that screens out a subset of these, limiting the list to stocks in the S&P 500 Index only. Individual investors might have other ways of screening the list.

If returns at the top of the list are “too good to be true,” then one can assume that either 1) there is a volatile event on the horizon (meaning the lognormal distribution assumption is wrong), or 2) the volatility assumption used in the expected return analysis is wrong.  Throw out any such items.  These would likely have annualized expected returns in excess of 100% – an unrealistic number for a naked put write.  However, weekly put sales might sometimes be in that range.  Those would have to be looked at separately.  In general, if the underlying stock is going to report earnings during the week in question, the put sale should probably be avoided.

At this point, I select all the writes with annualized expected returns higher than 24% (my minimum return for writing puts on margin), and re-rank them by probability of profit.  Once that is done, I select those with a probability of profit of 90% or higher, and re-rank them by annualized expected return.  In other words, I am still interested in high returns, but I want ones with plenty of downside protection.  This screening process knocks out most of the list, usually as much as 90% of the initial put writing candidates.

From there the analysis calls for some research, for at this point it is necessary to look at the individual stocks and options to see if there is something unusual or especially risky taking place.  Some stocks seem to be on the list perennially – Sears (SHLD), for example, perennially has expensive options due to its penchant for drastic moves.

Another useful piece of information is the Percentile of Implied Volatility.  That is listed in the data, and if it is low (below the 50th percentile), then I will likely not write that particular put.  Recall that expected return needs a volatility estimate – and for these naked put writes we use the current composite implied volatility.  However, if there is the possibility that volatility could increase a lot (i.e., if the current composite implied volatility is in a fairly low percentile), then there is a danger that actual stock movements could be much more volatile than we have projected.  Hence, that is not a naked put that I would want to write.

I also look at the absolute price of the option.  I realize that is taken into account in the expected return analysis, but I personally do not like writing naked options selling for only 20 cents or so, unless it’s on a very low-priced stock. 

The expiration date of the option is important to me as well.  I would prefer to write one- or two-month options, because there is less time for something to go wrong.  Occasionally, if there is a special situation that I feel is overblown on the downside, I will look into writing longer-term options but that is fairly rare.

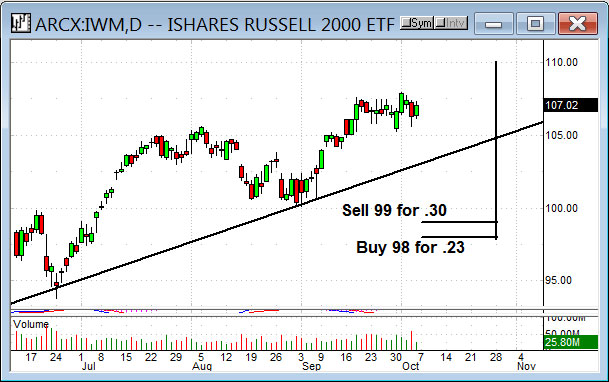
These further restrictions reduce the number of writing candidates down to a fairly manageable level.  At this point, it is necessary to look at the individual charts of the stocks themselves.  It’s not that I am trying to predict the stock price; I really don’t care what it does as long as it doesn’t plunge.  Consequently, I would not be interested in writing a put on a stock, if that stock is in a steep downtrend.  More likely, the chart can show where any previous declines have bottomed.  I would prefer to see a support level on the chart, at a price higher than the striking price that I am considering writing.  This last criterion knocks out a lot of the remaining candidates.

Some may say that the stock chart is irrelevant, if the statistical and other criteria are met.  That’s probably true, but if I have my choice of one that has chart support above the strike and one that doesn’t, I am going with the one that does every time.

The potential put selling candidates that remain at this point are generally few, and are the best writing candidates.  But I will always check the news regarding any potential write, just to see if there is something that I should know.  By “news,” I mean earnings dates, any potential FDA hearing dates, ongoing lawsuits, etc.  You can easily get a lot of this information by looking up the company on Yahoo Finance or other free financial news sites.

The reason that this news check is necessary is that these puts are statistically expensive for some reason.  I’d like to know what that reason is, if possible.  The previous screens will probably have weeded out any FDA hearing candidates, for their puts are so dramatically expensive that they would have alarm-raising, overly high expected returns.

But what about earnings?  Studies show that the options on most stocks increase in implied volatility right before the earnings. In general this increase is modest – a 10% rise in implies, or so.  But sometimes the rise is much more dramatic.  Those more dramatic situations often show up on volatility skew lists and are used as dual calendar spreads in earnings-driven strategies.  But as far as naked put writing goes, if the expected return on the put is extraordinary, then that is a warning flag. 

If a position meets all of these criteria, we officially consider it acceptable to establish and may recommend it in a newsletter.

I realize that many put sellers (or covered call writers) use a different method: they pick a stock they “like” first, and then try to find an option to write.  By this “fundamental” approach, one is probably writing an option that has a very low expected return – a la the calls on almost every “dividend stock” in the current market.  They compensate for this by writing the call out of the money, so that they will have some profit if the stock rises and gets called away. 

To me, that is completely the wrong way to go about it.  If you like the stock, why not buy it and buy a put, so you have upside profit potential?  What is the obsession with writing a covered call?

Rather than that “fundamental” or “gut” approach, the use of expected return as a guide to the position makes this a “total return” proposition – where we are not overly concerned with (upward) stock movement, but rather more concerned with the combination of option premium, stock volatility, rate of return, and probability of winning.  To me, that is the correct approach.

Selecting Naked Put Writes From OWB

Option workbench makes finding actionable naked put-sale trades that fit all of the criteria in my aforementioned approach quite easy.  Once you are logged into the software, one would first access the “broad” scan of potential candidates by hovering over “Spread Profiles” and clicking on Naked Puts.

A list of all the naked put writes that have annualized expected returns of greater than 4% will be shown (that 4% threshold would move higher if T-Bills ever yield anything besides 0%!).

Using the closing data from June 17, 2015, there were 14,449 such put writes!  Obviously, one has to cut that list down to a more workable size. 

There are a lot of 32 column headings here, and most are statistical in nature.  To me, the two most important pieces of data are 1) annualized expected return, and 2) downside protection (in terms of probability – not percent of stock price).  Both of these are volatility-related, and that is what is important in choosing put writes.  You want to ensure that you are being compensated adequately for the volatility of the stock. 

If you click on “A Exp Rtn” (which is Annualized Expected Return), the list quickly sorts by that data.  However, in my opinion, it is not a good idea to just sell the put with the highest expected return.  The computer calculations make certain assumptions that might not reflect the real world.  For example, if there is a large possibility that the stock might gap downwards (an upcoming earnings report, for example), the puts will appear to be overly expensive.  Any sort of upcoming news that might cause the stock to gap will raise the price of the puts.  You probably don’t want to write such puts, even though the computer may “think” they are the best writes to establish.

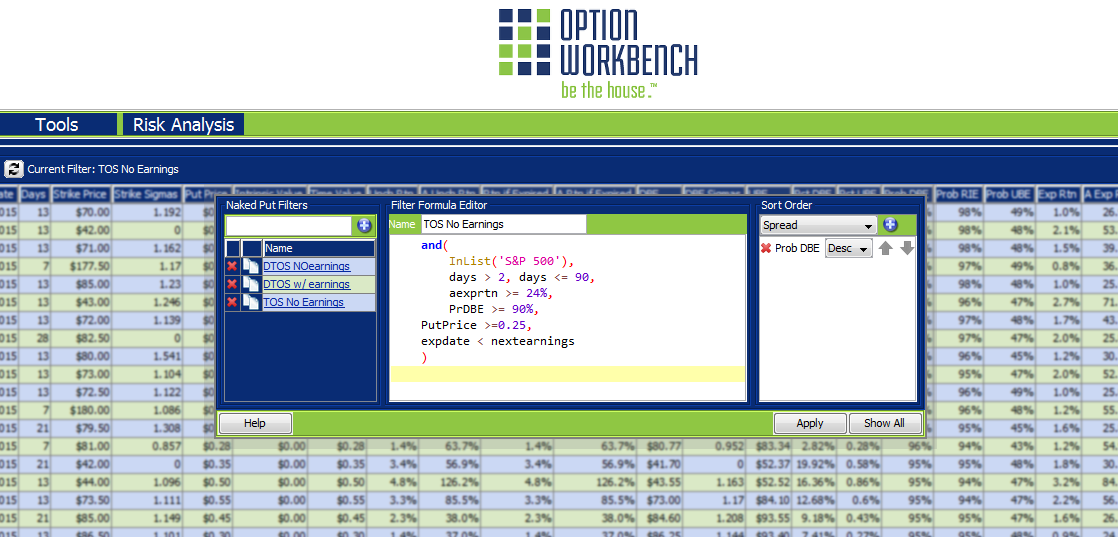
In order to overcome these frailties, one would use the “Filter Editor” function of OWB.  You can construct a filter to include or exclude writes that do/don’t meet your individual criteria.

Figure 3

If you click on the button (above the data) that says “Profile Filter Editor,” a box will appear.  Figure 3 shows the box as it appears in my version of OWB.  On the left are three filter names: DTOS Noearnings, DTOS w/ earnings, and TOS No Earnings (mine).  In the center of Figure 3, the actual formulae for the filter “TOS No Earnings" are shown.

To apply the formulae, merely click the “Apply” button (lower right of Figure 3).  In this case, the list of 14,449 potential naked put writes shrinks to 64 candidates!

Here are the formula that appear in Figure 3:

InList (‘S&P 500'): include only stocks that are in the $SPX Index.  This way, we are not dealing with extremely small stocks that can easily gap by huge amounts on corporate news.

Days>2, days <= 90: include only writes whose expiration date is between 2 and 89 days hence.

Aexprtn >= 24%: only include writes whose annualized expected return is at least 24%

PrDBE >= 90%: only consider stocks that have less than a 10% chance of being below the downside breakeven (DBE) point at expiration.

PutPrice >= 0.25: only consider puts that are selling for at least 0.25.

expdate < nextearnings: only consider put sales on stocks that are not going to report earnings while the put sale is in place.  Stocks are far too volatile on earnings announcements, and this will avoid the main cause of downside gaps: poor earnings.

These criteria produce a strong list of put writing candidates.  There will be no earnings announcements to cause downside gaps.  There is a 90% chance of making money.  Over time, writes such as these should produce returns in line with the expected returns – greater than 24%, using this formula.

You can add many other filters (or delete some of these if you wish).  It is easy to do within OWB, and I encourage you to experiment with it.

Once the list has been filtered, there is still work to do.  Why are these remaining puts so expensive?  One might have to look at the news for certain stocks to see why.  At the current time, health care stocks have very expensive options: ET, HUM, THC, for example.  Not only are these inflated because of takeover rumors, there is also supposedly some Medicare-related pricing edicts coming soon from the U.S. Government.  Those things could cause downside volatility; however, one may feel there is enough downside protection to warrant selling the puts. If that were the case, you would have found your trade!

Placing Your Trade

After you have found your trade the next step would be to determine how many puts to sell. Generally, for a margin account, most brokerages have a margin requirement of 25% of the strike-price of the short put you are selling less the premium received for the sale of the put less the out-of-the-money amount, subject to a 10% minimum. We generally write out-of-the-money puts and set aside enough margin so that the stock has room to fall to the striking price – the level where we generally would be closing the position out. This conservative approach decreases the risk of a margin call if the stock moves against your position.

For example, if you sell a naked put with a strike price of 50 for a credit of 1.00, the margin we would set aside would be $1,150. The formula below illustrates this:

Strike Price (50) x 25% (0.25) x Shares per Option (100) – Premium Received (100) = Margin Requirement ($1,150)

For cash accounts, one would have to set aside 100% of the strike price less the put premium. So, for the prior example, the cash collateral would be $4,900 (50 x 100 – 100).

We generally suggest that one puts no more than 5% of their total portfolio value in any particular put-sale for margin accounts, and 10% for cash accounts.

If you had a $100,000 margin account, you would want to allocate no more than $5,000 to any particular put sale. Using the prior example, you would then sell 4 naked puts ($5,000 / $1,150 = 4.35). Cash based accounts would sell 2 contracts (($100,000 x 0.10) / $4,900 = 2.04).

The next step would be determine your stop. Generally, we like to set our stops at the downside break-even level at expiration. This level can easily be calculated with the following formula:

Strike PricePut Premium = Downside Break-Even Level

However, if you cannot watch your position throughout the day, it may make sense to set your intraday stop at the strike price. This means that if the stock trades below the strike price you are short, the position would be automatically closed. That way, there would be no risk of assignment if the stock were below your strike at expiration.

Now that you have determined your quantity and stop, the final steps would be to enter your order (before the open with your brokerage’s order queue if possible), set your stop (via a contingent stop order if your brokerage allows) and monitor. Those who cannot generally participate during normal market hours and whose brokerages don’t allow order queuing and contingent stops, would only need a few minutes to initially place the trade. Furthermore, they would only have to monitor the trade near the market close each day to see if the stock is below their stop. If it were, one would simply buy back the put to close the position.

THE MOVIE

Do-It-Yourself with Option Workbench

Those looking to analyze potential naked put-writes themselves, can do so with ease with our Option WorkBench (OWB).

This is the overlay service to our Strategy Zone, and it provides the ability to sort the reports in various ways.  More importantly, it allows one to construct his own analysis formulae.

For information on the various features and capabilities of OWB, WATCH THIS VIDEO HERE!

THE SPECIAL OFFER

Find naked put-sale candidates on your own with a free 30-day trial to Option Workbench. Feel free to use my filter or create one of your own!

Scroll to the bottom and select the one month subscription ($135) and enter the Coupon Code FREEOWB at checkout. No credit card is required. Subscription will not automatically renew upon completion.

CLICK HERE TO SUBSCRIBE!

ABOUT THE AUTHOR

Lawrence G. McMillan is the President of McMillan Asset Management and McMillan Analysis Corporation, which he founded in 1991. He is perhaps most well-known as the author of Options As a Strategic Investment, the best-selling work on stock and index options strategies. The book – initially published in 1980 – is currently in its fifth edition and is a staple on the desks of many professional option traders.

His career has taken two simultaneous paths – one as a professional trader and money manager, and the other as an educator and proponent of using option strategies. In these capacities, he currently authors and publishes "The Option Strategist," a derivative products newsletter covering options and futures, now in its 24th year of publication. His firm also edits and publishes three daily newsletters, as well as option letters for Dow Jones. He has spoken on option strategies at many seminars and colloquia, and also occasionally writes for and is quoted in financial publications regarding option trading. Mr. McMillan is the recipient of the prestigious Sullivan Award for 2011, awarded by the Options Industry Council in recognition of his contributions to the Options Industry.

Chapter
06

How to Trade Your Retirement Account

By Kirt Christensen, Trading Science

Introduction

The financial crisis in 2008 brought to the fore the delicate balance of saving as you earn, and building up your retirement account. Accounts that were taxable suffered tremendously, and the market need for alternatives became distinctly acute. Counting down to your retirement can be thrilling if you have put aside a tidy sum in your individual retirement account (IRA). The reason that you should opt for an IRA rather than a typical savings account comes down to tax benefits, which ensure that you get a better return than simply following the traditional route. Take a look at Figure 1 for clarification.

Figure 1: Individual Retirement Accounts and Tax Deferrals

This figure shows you how your investment value from $10,000 can vary in a period of ten years, based on whether you choose an account with a tax deferral and one without. Clearly, the benefit of a tax deferral is excellent, as the benefit exceeds a return of $25,000!!

It is estimated that when you retire, your expenses will take up 85% of your pre-retirement income. Think about how you are saving now. Even when you have a 401(k) that your employer is sponsoring, and you are faithfully contributing to your IRA, it may not be possible to accumulate enough savings to maintain your standard of living.

There are options that you can explore if you want to increase the bottom line of your retirement account. Considering these options will bring you peace of mind, while helping you possibly increase your account balance to more than you had initially anticipated. Amongst the most favorable options you can consider is the Exchange Traded Fund (ETF).

All You Need to Know About ETFs.

To grow your retirement account, an exchange traded fund is a good option. It works as an investment fund which is used for trading on stock exchanges. It goes beyond typical stocks and bonds, as it also includes commodities and other assets, and it is able to track an index. This type of fund also has the advantage of being lower in risk by having a vast array of items in its portfolio, so the investor is not vulnerable to extreme market forces. This diversification can also be spread over a range of sectors within the economy, which allows for an element of balance.

The first surviving ETF was founded in 1993, and within a decade, in 2005, there were 204 ETFs that were operational. Move forward six years to 2011, and there were in excess of 1,100 ETFs, managing more than one trillion US dollars. The progression of ETFs is illustrated in Figure 2.

Figure 2: Growth of ETFs over eighteen years.

Money managers have taken to using ETFs since they are so simple to understand, and give excellent returns. They have even been nicknamed “hands-off” investments, since the money manager is saved from having to track them continuously in order to get a good return. Consider the direction you take when investing in stocks. You would be constantly trying to beat the market. This creates more situations where you could take a considerable loss. Instead, you should aim to perform with the market, which reduces your friction and vulnerability. The result is that over time, you will begin to make excellent gains.

When making a decision on what to trade, it is likely that you will consider mutual funds with the belief that they are the same as ETFs. There are some distinct differences, and understanding them will clarify why ETFs are the more attractive option. Mutual funds and ETFs both hold a portfolio of stocks, bonds and commodities. Both have rules which affect the balance of assets that they can have. However, when you make an investment in a mutual fund, it is owned by the mutual fund management company. The prices of the assets are based on what price the market will close with on a given day. Trade orders which are placed at the end of the day are valued at the closing price of the next day.

Should you make the decision to sell your shares in a mutual fund before the typical 90-day deadline, you will be charged a penalty. However, when you are dealing with ETFs, you are able to sell them short, which enables you to capitalize on your investment, particularly when you notice that it may be losing value.

With ETFs, rather than trading on common stocks through a management company, you deal directly with another investor and you trade on the exchanges. You are not restricted to purchasing your stocks at a certain time during the day. Instead, you can transact at any time that you wish. This enables the investor to take advantage of international trade opportunities as well as new markets. In addition, ETFs are considerably more flexible than mutual funds as it is possible to purchase them on margin, hold them long term, or sell them short, much in the same way as you would with common stock.

Cutting out the middleman and trading directly with other investors means that ETFs are more efficient than mutual funds. The processes are reduced, and therefore trades can happen faster. It is even possible to carry out all the trades using a computer, which lessens trading issues and costs considerably.

Why ETFs Are Excellent for IRAs

Stock trading is associated with incredible risk, and with good reason. During periods of financial crisis, even the most astute investors have made incredible losses, and struggled to bring themselves back up financially. When you are looking at growing your retirement fund, the last thing that you want to do is risk it all in the hope that you get a return. What happens if your investment fails? That’s something to think about.

Furthermore, when trading in stocks, there are a range of fees that you have to pay, including charges for every trade that is conducted. This is also true for mutual funds. With ETFs, the fees are much lower, which means that they will eat less into the existing funds or the gains in your retirement account. Consider the simple comparison in Figure 3.

Figure 3: Comparing Unit Trust Costs and ETFs Costs

NB: Unit Trust is the British Term for a Mutual Fund

Then there is the benefit of lower taxes. The reason is due to minimal internal trading within an ETF. This results in fewer taxable events, and coupled with trading using an IRA which is tax-favored, it is even possible to have taxable gains. If you want to avoid taxes completely, all you need to do is hold on to your shares for as long as possible as you will only have to deal with tax once you sell them. This means that you can control your capital gains tax. Other types of investment, such as mutual funds, will lead to capital gains tax as long as there is a profit, whether or not a sale has been executed.

If you are hands-on with your money and your IRA, you do not need to have extensive knowledge in financial management and trading to make a decision that will yield you a good return. With simple knowledge of the money markets, and some common sense, you can make decisions that will turn out to be highly profitable.

Choosing the Right ETF

Two different types of ETFs are ideal for trading your retirement account. The first type, “put ETFs,” have excellent growth potential and they do not need you to make payments on income taxes for the amount that you earn, or the existing principal within the account. It is assumed that the money which you have placed in the account and are using for investment purposes has already been taxed.

There are also “buying ETFs,” which are an excellent option if you have considerable time before your retirement. Ideally, these will fund your retirement and are highly time dependent—meaning they should be long term in nature. The time that you have between when you start investing and when you will retire will determine whether your portfolio will be made up of primarily stock ETFs or bond ETFs. Keeping this in mind, you can select an ETF from one of the following markets illustrated in Figure 4.

Figure 4: Different ETF markets

There are a range of ETFs available for you to choose from. These include simple ETFs, single commodities, niche ETFs, complex investing instruments, and so on. They also have various attributes, including being commission free, having low expense ratio and the potential to outperform the best indices. The key to making an excellent choice is to identify an ETF that is well diversified. This means that it should reflect a major index such as the S&P 500. If it is an ETF that is focused on just one sector, then it means that you are only covered financially within that sector. Should the sector be highly volatile, such as stocks, then you will have increased your risk.

There are also ETFs that are focused on small sectors, and those that take into consideration the entire stock market. You want to focus on the ETFs that are trading in the entire stock market over a period of time, as these are likely to give you the best returns. As long as you have made the decision of an ETF that covers the entire market, there will be no need to split hairs over the happenings in a specific sector.

When selecting your preferred ETF, ensure that you know what the investment goal of the ETF is. Even though they are typically an excellent choice for trading in your retirement, they have different goals and you want to capitalize on an ETF that will give you the return you desire to boost your IRA.

You should also ensure that your select ETF is liquid. A good benchmark is a common threshold of no less than US $10 million. Anything below this is an indicator that the ETF is up and coming, and therefore, there is every chance that you may face issues getting access to your funds as and when you need them. In retirement, when your sources of funds are limited, this could spell disaster.

If you start to trade your retirement account early, then you will be spoiled for choice when it comes to selecting your preferred ETF. Excellent options to consider are real estate and commodities, which are relatively stable and increase in value for the most part. Remember that when you make your choice, you should base it on solid research. Do not be tempted to give in to your emotions or gut feelings when it comes to your investment decision. Also, avoid taking on an investment because public opinion considers it to be viable. Find out everything that you can about that investment, and then you are able to make an informed decision.

Step-by-Step Guide to Trading your Retirement Account

The best place to start is by identifying an investment management company that has ETFs. There are several that are leading in the market. The ones that have ETFs that are geared towards retirement accounts include Vanguard, SPDR and iShares. Their ETFs cover several markets including indices, bonds, stocks (US), international stocks and so on. For this step-by-step guide, Vanguard shall be used as an example. Once you have identified your preferred company, open a brokerage account with them.

Step 1

Review the existing options on the site and select an IRA brokerage account. This will ensure that you are properly set up to begin trading. Once this is done, you should select a settlement fund. For IRA accounts, you do not need to look for an account that is exempt from taxes, as this will automatically occur by virtue of being an IRA account.

Step 2

Browse through the available ETFs on the investment management company’s website. There should be more than 50 for you to choose from. As you browse through, remember to keep in mind your overall goal, the risk that you are comfortable with and the duration that you shall be trading with the account. You should keep in mind that choosing a minimum of two ETFs would be good for a varied portfolio, though increased diversification from three to four ETFs is even better in the long run. Your primary criteria will be the asset class, then you can narrow down your choice even further based on your final goal. You will be able to compare information as in Figure 5.

Figure 5: Vanguard ETF List

In your portfolio, you may choose to select the Vanguard Total Stock Market ETF. This will give you the option of investing in the entire US stock market index, where you will find a good balance of viable stocks. This is especially ideal for any investor who has limited experience in trading and wants to be saved from a range of expenses. Furthermore, if you have considerable time before you need to use your retirement account, having this within your portfolio will lead to a higher return.

The Vanguard Total Bond Market is a good second option as you diversify from just the stock market to also include bonds. If you have only started considering trading your retirement account when you are close to retirement, then this would be the safest option to include within your portfolio. The expenses and fees are considerably lower and minimal effort is required to maintain trading.

The Vanguard Europe Pacific ETF is a good third option for your ETF portfolio. In addition to featuring several ETF stocks, one can benefit from its international stocks from emerging markets.

Figure 6 is an example of what a balanced ETF account looks like.

Figure 6: Balanced ETF Portfolio example.

Having a mix of stocks and bonds will help you create an excellent portfolio. This is because the stocks will drive your portfolio towards greater returns and growth, whereas bonds, though less profitable, offer an excellent amount of security. As explained, the security becomes more important the closer you get to your actual retirement.

The Benefits of Trading your Retirement Account

With more individuals looking to trade with their retirement accounts, an increase in unscrupulous vendors has become the order of the day. Therefore, careful research is required before settling for just anyone who wants to trade your retirement account. The reason is that often, these vendors are looking for ways to generate higher commissions by active trading. ETFs help to slow these people down, because the way that the trades are executed limits the role that these middlemen play.

Another advantage of ETFs is the appeal that they have for all types of investors. With hundreds to choose from, you will find an investment that you are comfortable with for growing your retirement account. This includes investments that have high risks and high returns, as well as those that are stable and will grow your account consistently over time. Due to the nature of diversification in the account, there is no need to worry about putting all your eggs in one basket.

Maintaining your retirement account when trading is relatively easy because, for the most part, you do not need to carry out constant trades. Once or twice a year, you should take the time to review your asset classes so that you can determine which ones are doing well, and which are not doing well. Then, make the decision on what you must buy and sell so that the account is able to rebalance well, while keeping you close to your goal. Doing this review will also help you to identify whether there are any increases in the fees or expenses that you are charged

There are nominal fees that you pay to a broker when you chose to trade through ETFs on your retirement account. However, these fees remains flat, no matter how many shares you are buying and selling. This means that when you choose to trade more shares in an ETF, the fees that you pay become less important as they make up a much smaller percentage of the overall trade.

THE SPECIAL OFFER

With all this information at your fingertips, there is only one thing left for you to do, and that is to utilize ETFs while trading your retirement account.

CLICK HERE to reserve your spot in Kirt’s webinar and learn his flawless system that will get you the results you are looking for.

ABOUT THE AUTHOR

Kirt Christensen is an internet entrepreneur and stock market investor who started his first company in 1996, at the age of 23. Since then, he's generated over $29 million in online sales, and placed thousands of trades in ETFs, stocks, futures and options. In the past few years, he's spent over $95,000 to perfect his own stock market systems, after ditching "main-stream" advice and methods. His goal and passion is developing trading rules and systems that the retail investor can use to profit five to 10% a month, in less than an hour a week.

Chapter
07

Intro To Forex With A Simple 123 Strategy

By Jody Samuels, FXTradersEdge.com

INTRODUCTION

Welcome to this mini Forex Foundation course, your roadmap to trading the Forex Markets. My name is Jody Samuels and my trading career began on Wall Street in the early 80’s. Today, I run fxtradersedge.com, a comprehensive program that offers courses and numerous coaching and trading services.

TradingPub asked me to explain what makes Forex a great market to trade so I thought I would start with some basic terminology and history, to show you how the market has evolved as one of the fastest growing markets to trade. I will then switch gears completely and talk about a strategy which is very easy for a new Forex trader to grasp. (It is even good for advanced traders!) The strategy is called the 123 continuation and reversal pattern and we will show how to use it during trend and end of trend cycles.

What is Forex?

Foreign Exchange Trading is known as Forex, or by the acronym FX.

Today we are going to talk about the transactions of the foreign exchange market known as the spot market. This market involves a worldwide electronic network of banks, brokers and other financial intermediaries.

Unlike the stock exchange markets, Forex has no physical location – it’s completely electronic. This ensures that transactions happen in seconds directly with the market makers. All profits are settled immediately in cash.

Figure 1: The Forex Spot Market

The Lingo in Forex is about pips and lots. What is a pip? If we look at the EURUSD at 1.1355, the pip is the last decimal place. When we talk about a move in the EURUSD of 5 pips, we are referring to a move from 1.1355 to 1.1360. The pip is 1/10,000 of a decimal place. A 100 pip move is from 1.1300 to 1.1400. If we look at the USDJPY at 117.30, the pip is also the last decimal place. If the USDJPY moves 1 pip in the market, it moves from 117.30 to 117.31. The pip is 1/100 of a decimal place. Nowadays, brokers quote to 5 decimal places in the EURUSD and to 3 decimal places in the USDJPY. For example, the EURUSD would be quoted as 1.13556 and the USDJPY would be quoted as 117.308.

Currencies used to only be traded in specific Lot or Unit sizes. If the unit is USD, a standard lot is $100,000. A Mini lot is $10,000. And a Micro lot is $1,000. Today, brokers allow traders to vary the Unit size without sticking to the standard Lot sizes. If you are wondering how a small investor can trade $100,000 without depositing that amount of money, it’s because of Leverage. The broker where you set up your trading account will require a margin to trade $100,000. That margin will vary according to the leverage the broker is willing to offer. At 50:1 leverage, the amount required to trade $100,000 is $2,000. The broker “lends” you the rest. Of course, any losses or gains on the position will be added to or deducted from the balance in the account.

Why trade Forex?

The Forex market has evolved faster than any other financial market in history. According to the Bank for International Settlements, the central bank for central banks, average daily turnover on the world's foreign exchange markets reached almost $1.5 trillion in 1998, increased to $1.9 trillion of daily trading in 2004, and skyrocketed to an unprecedented level of almost $5.3 trillion in 2013.

However, foreign exchange transactions existed a long time before that. Let’s learn a little history together.

Between 1876 and 1931 currencies gained a new phase of stability because they were supported by the price of gold. The Gold Standard replaced the age-old practice in which kings and rulers arbitrarily devalued money and triggered inflation. The Gold Standard was a commitment by participating countries to fix the prices of their domestic currencies in terms of a specified amount of gold. The Gold Standard prevailed until WWI, was reinstated in 1925, and broke down again in 1931 following Britain’s departure in the face of massive gold and capital outflows.

Beginning in 1944, countries operated under the Bretton Woods Accord. A total of 44 countries met in New Hampshire to design a new economic order.  The Bretton Woods Conference of 1944 established an international fixed exchange rate regime in which currencies were pegged to the United States dollar, which was based on the gold standard at a fixed value of $35 per ounce.

However, heavy American spending on the Vietnam War led to persistent U.S. balance-of-payments deficits and steadily reduced gold reserves. Finally, on August 15, 1971, President Nixon announced the suspension of converting dollars into gold, unilaterally devaluing the U.S. dollar and effectively ending the Bretton Woods Accord.

After the Bretton Woods Accord, the Smithsonian Agreement was signed in December of 1971. This agreement was similar to the Bretton Woods Accord, but it allowed for a greater fluctuation for foreign currencies. The US trade deficit continued to grow, however, and the US dollar needed to be devalued beyond the parameters established by the Smithsonian Agreement, and this resulted in its collapse in 1973.

In 1978, the free-floating system was officially mandated. This had occurred by default because no new agreements surfaced. At the same time, Europe gained independence from the dollar by creating the European Monetary System. This lasted until the introduction of the Euro in 1993.

Finally, the first online trade happened in 1997, which marked the beginning of the retail market.

Who Trades Forex?

An acronym I developed is the Be RICHeR network and this network trades Forex.

Figure 2: Who Trades Forex?

The Banks were involved in the Forex markets at its inception in the 1970’s.

The Retail Forex Brokers came on the scene after 1997.

Investment Management Firms have foreign exposures from their stock and bond portfolios and they transact with the banks.

Corporations in their daily, monthly and yearly foreign exchange transactions deal with the banks. The Central Banks are also key players managing their currency exposures and dealing with investment banks.

Hedge funds manage a variety of asset classes, including currencies, and they transact with Banks.

Finally, we have eRetail, dealing electronically through a trading platforms of retail Forex Brokers.

When you take your first currency trade, you too will become part of this Be RICHeR Network! Welcome.

OVERVIEW

Tradable Markets on a Forex Platform

In the Forex market, there are a great number of currency pairs to trade, which include the USD pairs and the Crosses. On the majority of Forex trading platforms, one can trade CFD’s as well as currencies. A CFD, or contract for difference, is a product whose price is based on the underlying instrument and is considered an over-the-counter (OTC) product, which is not traded on any exchange. CFD’s include stock indices, metals and energy products. For most brokers, the lists of offered instruments continues to grow. Now, Forex trading platforms are beginning to add CFD’s on stocks and ETFs as well. As retail traders, we have the ability to trade all of these instruments on Forex trading platforms. The number of markets quoted will vary from broker to broker.

Capture the “Flavor of the Day or Week”

Once we understand which markets can be traded on the trading platform, how do we decide which markets are trending? One way to do that, is to look at several markets at once to compare them. In this example we are looking at the major USD pairs to see if there is a particular trend in these pairs. Then we can do the analysis and decide which pairs to trade and when. Scanning charts like this is done to capture the “Flavor of the Day or Week” in order to stay with the trend.  In the example below, the USD pairs that have the cleanest price action include the commodity currencies, the USDCAD, NZDUSD and AUDUSD. The three other pairs – the EURUSD, USDJPY and the GBPUSD - illustrate choppy, sideways markets which are not high probability charts for the upcoming trading session.

In addition to scanning the charts for clean price action, it is necessary to review the news releases to be prepared for events which could move the markets. An understanding of the fundamentals is key to relating the price action to the economic backdrop affecting the markets.

Figure 3: Scanning the USD Pairs for Opportunities

The 123 Pattern as a Reversal Trading Strategy

Now we are going to move into the trading strategy section of this course. The simple trading strategy that I have selected is the 123 strategy for continuation trades and end of trend trades. First we are going to look at the 123 pattern as an end of trend, or reversal trading strategy, also called the 123 top and bottom pattern.

The 123 top and bottom pattern is a very powerful pattern that signals a trend reversal. It can also be used as a trend continuation, which will be described shortly. First, the reversal pattern.

Scenario 1: In an uptrend, the market hits a new high, labeled point 1. Price then pulls back to a short-term support level, labeled point 2. Finally, price moves up to an area between points 1 and 2, labeled point 3. It then reverses down again and begins a trend in the new direction.

Trade Entry: The pattern is complete when the price trades below point 2. At a 123 top, the strategy is to sell on a break of point 2. The measuring objective is the distance between point 2 and point 3, projected below the break at point 2. The stop loss is set just above point 3 but a more conservative stop loss is above the start of this move, at point 1. This is a choice that the trader must make and only by trading it over and over again will the trader feel comfortable with the choice of a stop loss.

An optional sell is at point 3, only if point 3 is at the 50% retracement level of the move from 1 to 2. Also watch for reversal candlestick patterns at point 3 to trigger the entry.

Figure 4: 123 Reversal Trade Entry

Figure 5 summarizes the 123 top and bottom trade. We just looked at scenario 1 which is the 123 top. Now we will discuss the opposite scenario of a 123 bottom.

Scenario 2: At a 123 bottom, the market hits a low at point 1, trades up to point 2, trades back down to point 3, and back up through point 2 to begin a new uptrend.

Observations:

I like to see point 3 retrace at least 50% of the move down from point 1 to point 2. I also learned that if the pattern has between 10 and 20 bars between points 1 and 3, it is more likely to succeed. What I have to say about that is back test and see for yourself. I take most of my trades based on this pattern alone. It is very powerful. You can also use this pattern on a smaller time frame once the market reversal is identified. You will get a closer entry to point 1 and will therefore be able to take a larger position, using the same money management rules.

Figure 5: 123 Top and Bottom

Notes

  1. The 123 formation is classified as a major reversal pattern and is one of the best indicators of a trend reversal. They are found on every time frame. The swing or position trader will look for these patterns on the weekly, daily and 4-hour charts. The day trader will look for 123’s on the hourly and 15-minute charts. The momentum trader will trade these patterns on the 5-minute, 1-minute and tick time frames.
  2. Stop losses for 123 tops should be set above point 1 initially, and positions need to be sized accordingly so as not to exceed the risk limit for the trade. Another option is to place stops above point 3. However, the odds are increased of being stopped out early. It is better to take a smaller position and leave the stop above point 1. Stop losses for 123 bottoms are set below point 1, or alternatively, below point 3.
  3. Optional: On a 123 reversal using any time frame, wait one or two candles for confirmation.  Ideally price will come back and retest the breakout or breakdown point for a safer entry. This helps to avoid whipsaw.

At this point in the video we look at more 123 reversal examples using market data.

The 123 Pattern as a Trend Continuation Strategy

We have just completed the section on the 123 reversal pattern as confirmation of the end of the trend. However, while the end of trend 123 top and bottom is a great entry method for taking reversal trades, most of your trades as swing and day traders will be trying to get into a trend move – getting into the trend in the middle of it. You may have heard that “the trend is your friend”, so now we will learn a method to get into a trend move using the 123 trend continuation pattern.

How do you get into the trend in the middle of it? The safest trades you can make are the ones where you are trading in the direction of the current trend. In other words, if the trend is up, you should be long – and if the trend is down, you should be short. If you miss the start of the trend, you still need a method to enter a confirmed trend during its progress. I am going to suggest two entry methods using the 123 pattern for trend continuation called internal 123’s.

Figure 6: 123 Trend Continuation Trade Entry

Method 1:

Draw your 123 points as price moves in the direction of the new trend.

Enter on a break of the newly established point 2 with a stop above point 3.

Follow the market up or down, depending on the trend.

Method 2:

Draw your 123 points.

Enter at point 3 (once price turns down) with a stop above the new point 1.

Figure 7 illustrates both the 123 reversal and the 123 continuation, back to back, on the same market, the 4-hour USD/CAD.

Figure 7: 123 Trend Continuation Trade Entry with 123 Reversal

Notes

  1. When the “Trend is your friend”, we need to make sure we get into the trend at various points along the way. Why? The safest trades are taken in the direction of the current trend. Trade entry is easily done with the internal 123 formation.
  2. In a trend, the first 123 pattern is the reversal pattern that occurs at market tops and bottoms. The second and third sets of internal 123’s continue to confirm the uptrend or downtrend.
  3. Take note how each point 3 becomes the new point 1 for the next internal 123 pattern. In a very strong trend, point 3 will not always retrace to at least the 50% mark, and that’s ok. It is more important for that to occur with reversal 123’s. In a strong trend, the retracements can be as shallow as 23.6% or 38.2%.
  4. If you miss the initial reversal 123 pattern, look to get into the subsequent internal 123’s. Preferred entry is on the break of point 2. However, alternatively, you may enter at point 3. And, wait for the candles to start trending again before entering.
  5. Profit taking is recommended along the way for day traders. Position and swing traders may hold the positions and trail the stop every time we trigger a new trade. The stop would then be placed above the new point 1, and previous stops would be moved to the new point 1. These positions would be considered “add-ons” for position and swing traders.

At this point in the video we look at additional 123 continuation examples using market data.

CONCLUSION

The Forex markets offer an opportunity to trade various currency pairs and CFD’s as well. Once a trader understands that all of the markets are related in some way – currencies, commodities and stocks – and that correlations exist between certain markets, the excitement comes in understanding these relationships in order to confirm market moves day in and day out. Learn the fundamentals, scan the markets for the best markets to trade, and select a simple strategy such as the 123 Strategy to stay with the trend, or find the end of the trend for a market reversal.

THE MOVIE

See Jody expand on her strategy in this video! SIMPLY CLICK HERE TO WATCH IT!

THE SPECIAL OFFER

Get Jody’s special offer of her Back to Basics Seminar with 1 Month of her Premiere Market Analysis!

SIMPLY CLICK HERE FOR YOUR COPY!

ABOUT THE AUTHOR

Jody Samuels is one of North America’s leading coaches for successful traders, and the creator of The FX Trader’s EDGE™ Program. She works with members of her program in group and private coaching sessions and is passionate about teaching individuals how to trade the market cycles and use entrepreneurial skills and habits to effectively manage their businesses.

Jody Samuels, a professional trader with 15 years’ experience trading currencies with a New York international investment bank, successfully made millions of dollars using the proven theories of Elliott Wave analysis. The Elliott Wave Ultimate Course, Jody’s latest accomplishment, illustrates the convergence of Elliott, Fibonacci and Harmonics in a ground breaking program to combine precise analysis with a simple strategy.

Chapter
08

Options Trading and Market Profile / Auction Market
Principles

By Tom Alexander, AlexanderTrading.com

Options traders are keenly aware of, and sensitive to, TIME. There is no methodology that highlights the aspect of time in how a market develops than Auction Market Principles, and no charting format that better highlights the present Market Condition of the state of Market Development than Market Profile.

The worldview of Auction Market Principles and the charting format of Market Profile can be powerful tools in the option trader’s decision making process. Below is a very brief description of Auction Market Principles and the Market Profile graph.

The Auction Market Process and Underlying Principles

The Market Profile™ graphic IS NOT what one is trading. Market Profile™ is a graphical depiction of a specific type of activity: the organizational activity of a freely traded auction market. It is a concept based on Value as determined by the buyer and seller through a free market medium – an auction process. A profile graphic organizes trading activity on a chart in a format that is the best available visual depiction of the process of an auction market in progress. What is being traded is the Market Development (macro activity) and Market Structure (micro activity) that is formed in an auction market process. The profile graphic is a charting format that enables the trader to read this activity and make informed consistent decisions about what is happening at a given price level and why.

Key Reference Areas are formed as a result of the trading that occurs within the profile graphic. These Key Reference Areas are inflection points created by the activity of market participants that carry specific meaning and therefore can be read, interpreted and used to make trade decisions. It is critically important to understand certain basic precepts about an auction market and how the activity of an auction market is displayed through the profile graphic in order to derive practical, actionable information at the trade execution level.

Market Profile™ IS NOT a trading system. It provides a platform of tremendous depth and breadth around which a rules based trade plan can be developed. An example of a specific rule based trading system is outlined in detail in Don Jones’ book, Value Based Power Trading.

The purpose of a market is to facilitate trade. In an auction market for objects of fungible value, as with a stock or a stock index, or a financial futures or commodity contract Value as defined by the actions of buyers and sellers can be closely determined. Value resides in a range that is determined by the buyers and sellers. Within this range there are areas of more or less value.

The greater activity or volume the greater the value, and near areas of less value to either the buyer or seller there is less activity or volume. In this value determining process the market will drive prices higher until there are fewer and fewer buyers to the point at which there are no buyers.

The same process will see the market driving prices lower until there are fewer and fewer sellers until the point there are no sellers. These two opposite actions are necessary parts of the auction process of probing and discovery in a search for value and to confirm value. The driving of price higher until there are no more buyers and lower until there are no more sellers establishes the range of the auction in progress.

The very highest prices represent the area that is least fair to the buyers and the very lowest prices represent the area that is least fair to the seller. Because the purpose of the market is to facilitate trade and because the market is constantly in a probing mode searching for and confirming value, price usually moves sharply away from either extreme of the unfair high price level of the unfair low price in search of the fairest value.

It is logical that most of the trading will occur at what are the relative fairest prices to both the buyer and seller. In other words, the most activity, or volume, will occur where there is the greatest consensus of Value and the least volume will occur where there is the most unfair level of pricing to either the buyer (the highest prices) or the seller (the lowest prices). It is important to note that the area of concentrated activity within a profile unit is created by a rotational process; buyers and sellers do not just “sit” in one small area and trade back and forth. The testing and probing for Value is a rotational process during which the market will trade back and forth from one extreme of a range to the other and in the process creating an area usually near the mean of the range where the area of most activity lies.

Market Profile™ Graphic Basics

The traditional Market Profile™ graphic uses letters to depict the vertical range of each specific thirty-minute time period in a trading unit (the day session of the stock index futures, for instance). The trading session of a given asset is divided into thirty-minute time periods with each time period being assigned a letter.

The initial instance during the trading session within a designated thirty-minute time period the market trades at a price a letter designated for that thirty-minute period is placed on the chart. Only one letter per time period will print regardless of how many instances price trades at that level within the thirty-minute period.

When the thirty-minute period completes the next time period begins as the chart shifts one column to the right and the letter designation changes. Another way of stating this is that each letter is basically a thirty-minute bar, but instead of a straight line the bar is a vertical line of a single letter representing a designated time period.

The letters used to designate the trading activity are referred to as TPOs, which stands for Time Price Opportunity (per Steidlmayer), or That Price Occurred (per Jones). A TPO signifies that a market traded at least once at a specific price within that designated time period.

A profile’s rotations, or designated time periods can be any length of time. We quite often look at daily profiles where each letter will represent one day’s trading. Because Market Development and Market Structure occur in all degrees of time all the time, the same objective analysis can be applied in the timeframe most useful to the individual trader.

A very important point is that regardless of the timeframe one chooses to trade, all the way down to the very short-term day trader, because the processes of Market Development and Market Structure are occurring across all timeframes all the time, the context of the present phase of development within the larger phases of development can provide a huge edge, and is one of the primary benefits of using this methodology as a model to develop a trading plan.

Two other components of the traditional Market Profile™ chart are the Initial Balance period and the Value Area. The Initial Balance Period is the range of the first two half-hour periods of the trading day or session for that particular contract. The Initial Balance Period was extremely important in the early days of Market Profile™. It was used to help define potential range as well as help identify when the institutions or other big money participants (often referred to as “other timeframe players”) were initiating positions.

The theory was that most of the range in the first hour of trading was determined by the floor traders. If the floor was in control of the market the range would be relatively narrow and there would not be much extension outside of the first hour range. Because floor traders had negligible transaction costs and could make money while price stayed in a relatively narrow controlled range, there was no incentive for range extension as long as the floor traders were in control of the marketplace.

If the range suddenly extended outside the range of the first hour it was most often because the off floor traders of institutions were imitating positions and their size would push the market directionally outside the range of the first hour of trading, or Initial Balance Period . The amount of buying or selling the off floor trader conducted during the day would determine the form of one of several typical Market Profile™ day-type patterns. This will be discussed in greater detail a bit later.

It is important to note that in Market Profile™ literature through the mid 1990’s the Market Profile™ concept emphasized each day as a discreet event, but one that had predictive value regarding near term market direction based on an interpretation of the particular day type that was formed.

The other component found on a traditional Market Profile™ chart is a vertical line denoting the Value Area. The Value Area represents the area that contains 70% of the trade activity of a given profile unit. This can be a measurement of TPO activity, or volume. The overwhelming majority of the time a Value Area calculation is extremely similar regardless of whether volume or TPOs are used to calculate the Value Area.

Below are several days of trading displayed in the Market Profile™ format.

One of the obvious differences between a Market Profile™ chart and a bar chart is the information that is available on the horizontal scale of the chart. It is easier to see the amount of activity that occurred at a given price or area of prices on a Market Profile™ chart than a bar chart. As we will explain in detail later, this is a critical and defining difference.

Trading Market Development and Market Structure

Market Development and Market Structure  has as its basis Don Jones’ Auction Market Value Theory©.  The gist of Auction Market Value Theory© is that all free markets exist for the purpose of facilitating trade and that market participants - buyer and sellers, identify value, or lack thereof, by their actions. An auction is a price discovery process between buyers and sellers. Bids and offers are made between buyers and sellers until they reach an agreement on price. Prices that are too low will not have many sellers (offers) and prices that are two high will not have many buyers (bids). If prices are too low or high they are generally “unfair” to the buyer or seller and will not do a good job of facilitating trade. Price will gravitate to the area in which there is the greatest agreement on price. A profile graphic displays this process of Market Development. The area of greatest value is that area where trade most easily occurs between buyers and sellers. This is usually where the greatest volume will be and where a market spends the most time trading. Where and how much buyers and sellers conduct their business describes the present state of Market Development and is the determinate of what Value is in a given timeframe.

The primary tenet of Market Development is one of Value; markets constantly rotate between two cycles, or phases of development, either Horizontal Development (Balance) or Vertical Development (Imbalance). A market in Horizontal Development is one in which there is general agreement among buyers and sellers as to what is fair Value. A market in Vertical Development is a market in search of Value.  A profile graphic visually displays both forms of development. Everything about Market Development is quite logical. The various threads that weave together to form the larger concept of Market Development are logical, consistent and simply “make sense”.

Markets are in constant development between Balance and Imbalance. Balance occurs when market participants generally agree on value. Imbalance occurs when there is disagreement and the market is trending in search of value. The conviction of one side of the market (either the buyer or seller) overwhelms the other during Vertical Development. Balance is reflected visually in a profile graphic as consolidation and Imbalance is reflected visually as trend. Balanced markets are efficient markets, and Imbalanced markets are inefficient markets. “Efficient” and “inefficient” is being used in the context of how effectively trade is being facilitated. All consolidations (Horizontal Development/Balance) eventually end when there is no longer an agreement on what is “fair” Value between the buyers and the sellers. All trends (Vertical Development/Imbalance) end when price reaches a level at which there is a relatively balanced agreement between buyer and seller as to what constitutes a “fair” price. The above is true across all time frames.

Balance (Horizontal Development)

Below are year profiles of the S&P cash (each letter represents a weekly range).

Imbalance (Vertical Development)

Below is a profile displaying the Vertical Development of the S&P cash during January, 2016 (each letter represents one day’s range).

Steidlmayer in Steidlmayer on Markets, Trading with Market Profile™….. describes the Balance to Imbalance cycle as taking four steps:

This market-generated continuum can be clearly explained using what is called the four Steps of Market Activity. It is the process markets go through to factor out inefficiencies. Inefficiencies are defined as the directional move, money flow, or distribution that propels prices sharply higher or lower within a defined amount of time. This viewpoint can be from a micro or a macro perspective. In other words, one can monitor a 5-minute, 30-minute, daily, or any duration in between and visualize this phenomenon. It is one of the most important, if not the most important, skill a trader must learn and apply to be successful. The four steps are:

  1. Series of prices in one direction
  2. Trade to a price to stop the market
  3. Develop around that stopping price
  4. Move to efficiency (retracement)

The above description of how markets transition from Balance to Imbalance is a key to understanding the link between early the early profile literature of Steidlmayer and the evolution of the concept represented by Don Jones’ work. Steidlmayer’s newer work is very much in line with the conclusions of Don Jones’ research that began in the late 1980’s and that continues to this day. 

Markets very closely follow the above Four Step process with one important exception: The process is most often a three-step process without the deep retracement and “filling in” of the entire vertical range established in Step 1. For practical trading purposes it makes little difference because a completed Step 3 is simple a mini Balance Area (an auction of small degree) from where the market will transition into a Vertical Trend and the process will begin again.

It is important to understand the Four Step Process and some of the surrounding trade concepts that were subsequently derived from it.

Steidlmayer’s Four Step process is his description of the life of an auction from beginning to end. This is a process (auction process) that is occurring all the time in all degrees of time, so we see auctions within larger auctions.  

Step One establishes the vertical range of the auction. Step Two is when the market begins to become two-sided - buying and selling begin to even out. Step Three establishes a smaller range of trading within the larger high and low extremes established in Step One. Step Four is a probing and further “development” of the entire range established in Step One. Step Four typically involves the forming of “mini” auctions, or small consolidations that subsequently breakout but stay within the extremes established in Step One. Step Four involves the “maturation” of the larger auction and leads to the inevitable transition to Step One and the process begins again. Implicit in this description is that most of the volume in the vertical range will eventually be established near the midpoint of the range and will have the look of the bell shape of a statistical distribution. The highs and lows will eventually form the 1st and 3rd standard distributions and the mid-point the 2nd standard distribution.

Step 1 is a vertical trend that is dominated by what Steidlmayer labels as “Minus Development”. Minus Development is an area in which strong conviction on the part of either buyer or seller overwhelms the other side of the market. It is called “Minus Development” because it is a range that has not yet been probed by the market in two-sided trading – it lacks development. The underlying assumption is that such an unexplored range will eventually be “developed” and trade will occur throughout the vertical range established in Step 1, though the amount of trade at a given point within the range will vary.  

Steidlmayer further describes Step 2 and Step 3 as forming the look of either a “P” or a “b”. Price establishes a range extreme in Step 2, then in Step 3 price begins to develop (a two-sided market begins) and establishes a trading range near one of the larger range extremes. This process forms the look of a “P” if  Step 1 was a vertical move to the upside. It forms a “b” if Step 1 was a vertical move to the downside. Steidlmayer incorporates the statistical distribution concept into this process by labeling the forming of a P a 3:2:1 and a b a 1:2:3. The “1” and the “3” represent the third standard deviations and the “2” the mean. Step Four involves the market developing the bell shape and thus is labeled a 3:1:3 where there are the more typical tails (3rd standard deviations) of a statistical distribution with the most occurrence of activity near the mean or 1st standard deviation.

The underlying assumption from the above is that the market is imbalanced in Steps 1-3 and will come back into balance in Step 4. In today’s markets Step 4 is often truncated or skipped altogether. This is a very important concept that addresses the ever evolving nature of markets. The market is a dynamic organism. As a result, a dogmatic approach with any methodology is doomed to fail. The beauty of understanding Market Development and Structure is that it allows one who is open to seeing what is happening in the evolutionary process of the markets to adapt and prosper. This is because the underlying basics and concepts of Market Development and Structure have not changed. They have simply sped up. This may seem to be a minor change, but it is being missed by most traders, and that includes professionals.

In summary to this point: Balance, Horizontal Development, Consolidation are synonymous terms and represent one phase of market development. Markets spend the vast majority of their time in this phase. This is perfectly logical and consistent with the underlying principles of an auction market we discussed earlier. The purpose of a market is to facilitate trade – to allow buyers and sellers to efficiently conduct their business. Most business will be conducted at the fairest prices as agreed upon by the buyer and seller and as verified by their actions. This “force” results in a range of fair prices in which an auction will develop and mature. This is what we refer to when we say we are trading Market Development. “Development” infers a time component – time is a requirement for anything to “develop”.

Imbalance, Vertical Development, and Trend are synonymous terms that represent the other phase of market development. This phase results in the majority of net price change. Markets spend the least amount of time in this phase.

These two phases are occurring all the time in all degrees of time.

Summary

An understanding of the immutable and consistent processes of how Auction Markets develop can greatly assist the options trader in determining the best strategy to employ depending on the present condition of the market. Just a basic understanding of Market Development can give the option trader a huge edge. This market worldview is based on time, which is the biggest piece of the puzzle for most options traders. 

THE SPECIAL OFFER

Get your free introductory course  An Introduction to Auction Market Trading!

 SIMPLY CLICK HERE FOR YOUR COPY!

ABOUT THE AUTHOR

Tom Alexander is the founding partner of Alexander Trading, which was founded in 2003 as a trading and research firm serving both institutional and retail investors and traders. Tom has 27 years of trading experience, and actively trades stocks, options futures and commodities. Within the trading industry Tom has been a stockbroker, commodities broker and owned a commodities and futures brokerage firm. He has been a CTA (Commodity Trading Advisor). He has also been involved with institutional trading and advising. He traded large private accounts for over ten years. He has been published in several well-known trading magazines, and is frequently quoted by Reuters, Dow Jones and Bloomberg. He is the author of Practical Trading applications of Market Profile Ö. He has traded through market crashes (1987, 2008), financial crises (1998), bull markets (1990’s), bear markets (early 2000’s) and wars (Gulf and Iraq).

He has learned the only constant in the markets is change, and he has been able to successfully adapt his trading methodology to a broad range of market conditions. Tom has spent his entire twenty-seven year career as a screen-based trader and is intimately familiar with all screen-based tools and techniques. As a trading mentor, Mr. Alexander has achieved extraordinary success helping traders with the transition from the floor to the screen, helping successful traders further along their goal of achieving their maximum potential. A common theme among his clients is that the methodology being taught, and how it is taught, dramatically lowers the typical stress levels a trader feels while increasing their profitability.