Chapter
01
The Hooke Pattern


Thank you for accessing the “7 Chart Patterns” eBook. This book is designed for beginning, intermediate and advanced traders. The authors in this book are leading experts in trading Stocks, Options, Futures and Forex.
As you read this book, you will be exposed to multiple strategies that have high probabilities of success and/or high profit. Many of the strategies in this book are divided into three sections:
In short, you will have all of the information you need to trade your new favorite strategy tomorrow. Some of the things you will learn in this book are:
At 52Patterns.com, it is our sincere hope that you take away several strategies that you can use when you are done reading this book. You will also learn about markets that you currently don’t trade, and you will find out if they are suited to your trading personality.
Finally, make sure to subscribe to 52Patterns.com. We provide free eBooks, reports, on-demand videos and many other publications for active traders in all of the markets. Our presenters are world-renowned industry experts and our content is provided free of charge in a relaxed and friendly setting. Cheers to your trading success!
As long as buyers and sellers have been trading the markets, two predominant sentiments have been in play: fear and greed. Centuries ago, Japanese rice traders developed the candlestick method to graphically depict trader sentiment. It has worked successfully for hundreds of years, and still works today. Candlestick analysis can help you make better trading decisions about investor sentiment in the markets.
The Japanese rice traders didn’t just become wealthy using candlesticks, they created legendary wealth trading a basic commodity. This method works for any trading instrument as long as the basic human emotions of fear and greed are involved – which pretty much covers every market.
Candlestick analysis prepares you to be ready for big price moves based on historic results of specific signals and patterns. It’s simply a graphic depiction of investor sentiment. The Japanese rice traders gave us not only the benefit of knowing what the signals look like, but they also described what the investor sentiment was behind each signal There are 50-60 signals to learn, but eight of the most successful candlestick signals will be discussed in this lesson.
The most beneficial thing about candlesticks is that they help identify trends.
But first, to help identify trends, you need a few indicators. Here’s what they are:
These indicators are important because every money manager in the world uses these indicators to help them make decisions when trading their portfolios.
The most important indicator is the T-Line, which is the 8 Exponential Moving Average (EMA). The T-Line has some very simple rules:
Stochastics are used to indicate overbought and oversold conditions. If you see a candlestick BUY signal in an oversold condition, there is a strong probability that you are going to be going into an uptrend. Conversely, if you see a candlestick SELL signal in an overbought condition, you are likely heading into a downtrend. The settings that I use for stochastics are 12,3,3. These settings have worked the best for what I do most of the time, which is swing trading.
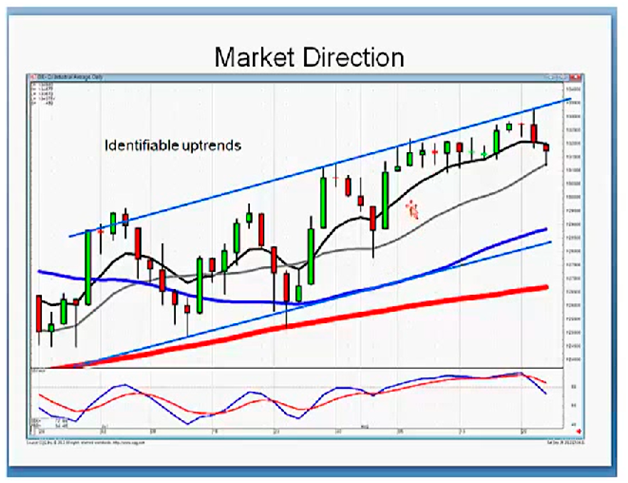
Summing it up, if you plot the 200, 50, and 20-day Simple Moving Averages, along with the 8 Exponential Moving Average, and stochastics set at 12, 3, 3 – then you are good to go. Let’s see how these indicators work with candlestick patterns:
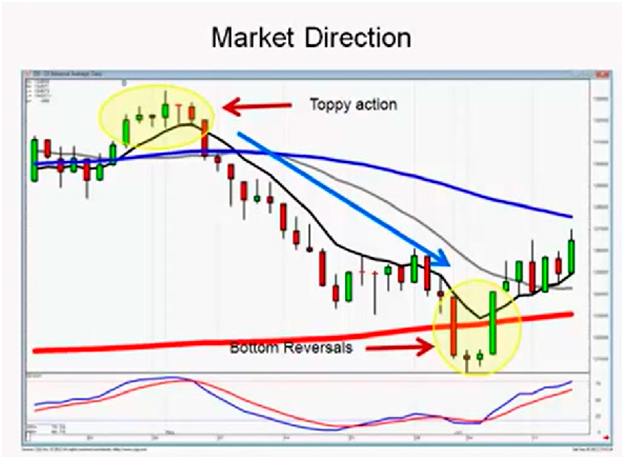
In this daily chart, the stochastics are in an overbought condition with candlesticks above the T-Line. Once they turn red and break through the T-Line, a downtrend is established until a Morningstar pattern at the bottom triggers a reversal to the upside.
The rest of this chapter will be devoted to the top bullish candlestick power signals. If you know them and can identify them you will have a much better handle on identifying trader sentiment.
The Top Eight Bullish Power Signals
Your Best Friend
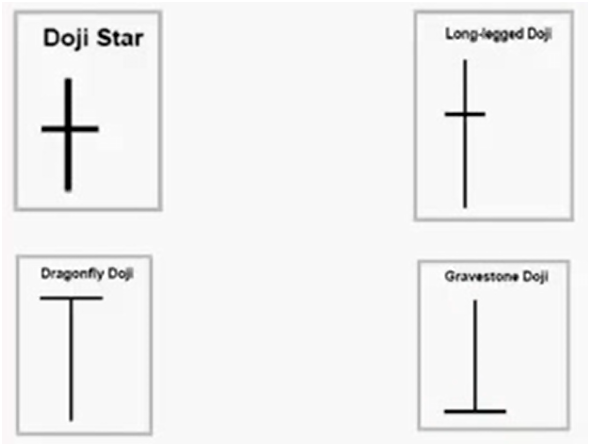
A Doji occurs whenever the market opens and closes at the same level during a particular time frame.
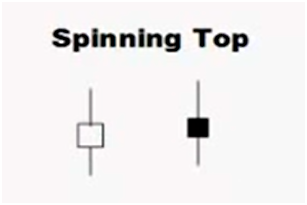
A derivative of the Doji is the Spinning Top. Spinning Tops are characterized by short candle bodies with short wicks, similar to the child’s toy. Spinning tops signal indecision between the bulls and the bears in the marketplace. When you see a spinning top or Doji at the top, you want to consider taking profits. If you see them at the bottom, there’s likely to be an uptrend.
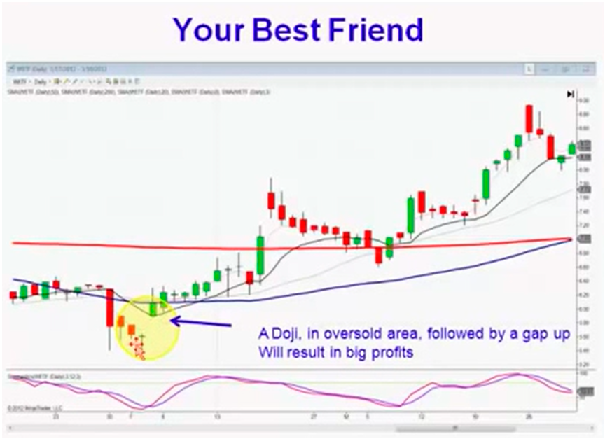
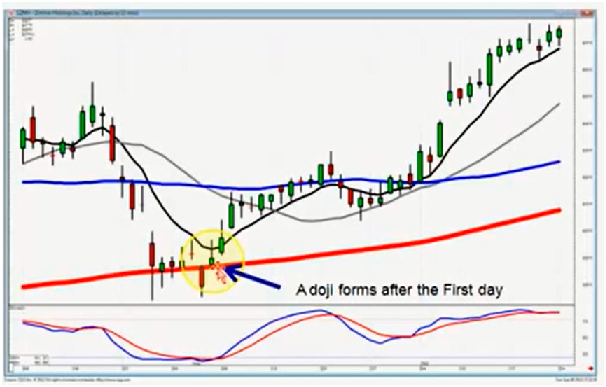
A Doji in an oversold area, followed by a gap-up, gives you a very strong probability that you are about to enter a strong uptrend. The beauty of candlesticks again is that they capture investor sentiment. When you are at the bottom of the market in oversold territory, as indicated by stochastics, and a Doji appears, it signals indecision. If it is followed by a strong gap-up, closing above the T-Line, then a strong uptrend is building.
One caveat to this strategy is that when the candlesticks start moving well above the T-Line, they are going to want to come back to the T-Line, so you want to be prepared to take profits if necessary.

To summarize, here are the optimal criteria for the “Best Friend: scenario:
Note: At the end of this chapter, click on the YouTube presentation of this topic for many more examples of the “Best Friend” bullish signals in action.
Left/Right Combo
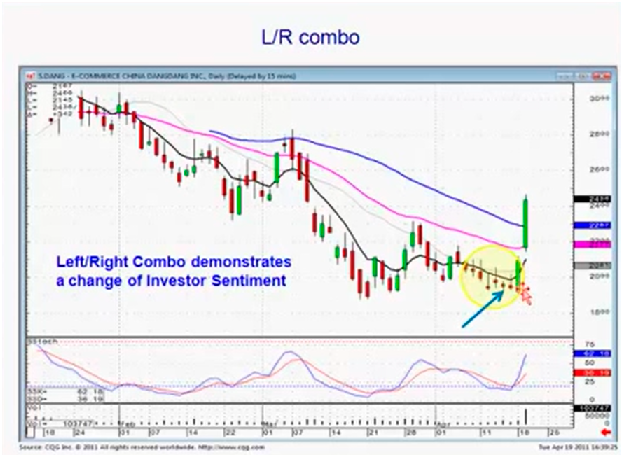
The Left/Right Combo is a Doji followed by a bullish engulfing signal. The bullish engulfing signal completely encapsulates the previous candle body. Since the Doji body is small, it represents a moment of indecision followed by a clear bullish move. The Left/Right Combo is like a boxer setting up a small left jab with a roundhouse right punch. In this example we have a small Doji, followed by a bullish engulfing signal and a strong upward move in the stochastics. Notice there is a series of Dojis in this chart. If one Doji signals indecision, a series of Dojis indicates greater indecision. If you see a strong candlestick buy signal, followed by a series of Dojis and the next bar gaps-up significantly, a strong bullish move is in play, and you want to be buying.
Series of Dojis

Remember that a Doji represents indecision. If you see a series of Dojis it represents greater indecision. When you see a series of Dojis setting up, and stochastics start moving up, with candlesticks closing above the T-Line, it signals a positive open the following day and trigger to buy. Bear in mind, you still need to do your due diligence. Make sure to check the pre-market futures the next day, and make sure there isn’t any economic or geopolitical news that could adversely impact your decision to buy. But if the futures are moving in the same direction as your trend, it’s a signal to proceed and buy.
Candlestick Patterns followed by Gap-Ups
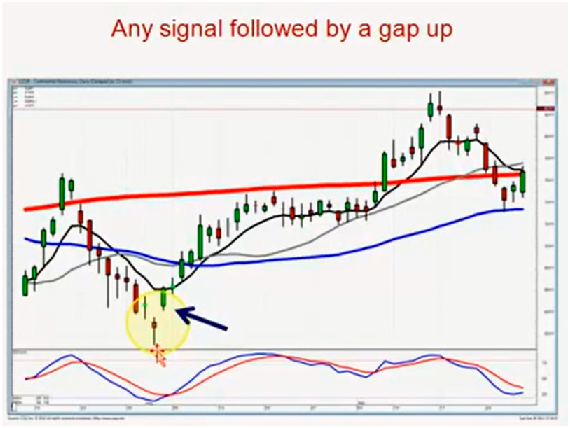
Any signal followed by a gap-up is a signal to buy. In this case, we have a hammer signal, followed by a bullish gap up. Once the candles close above the T-Line along with a corresponding upward move in the stochastics, it signals a strong buying trend.
When we see a gap-down in an oversold condition it’s just telling you that most people panic when the market is at the bottom. How can you tell if the market is at its bottom? With candlestick patterns, once you see a gap-down in an oversold condition, start looking for signs of a reversal. It could be a Doji, a series of Dojis or a gap-up reversal.
Bullish Kicker Signal
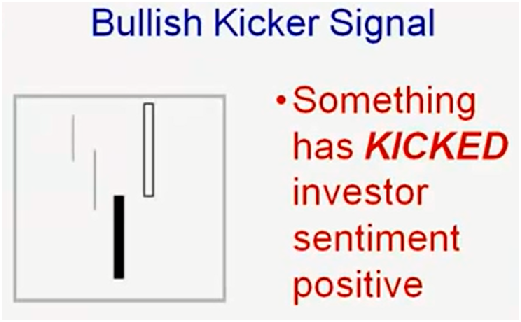
The strongest of all buy signals is the Bullish Kicker Signal. This is when the market is in a downtrend, and the following bar opens in a gap-up above the previous day’s high. This pattern signals that investor sentiment has been kicked the other way.
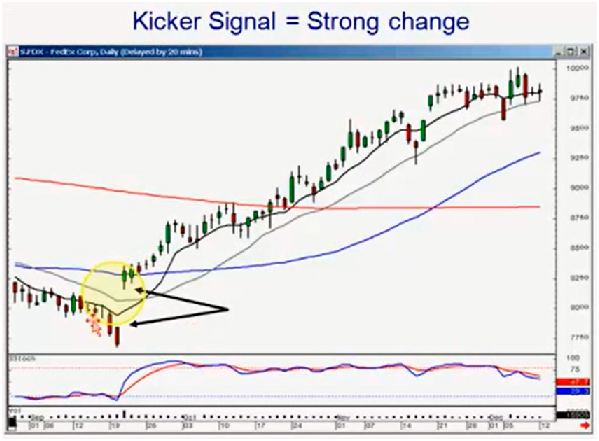
In this example, there is a significant gap-up above the previous day’s downtrend. The gap-up is well above the T-Line and there’s a strong upward move in the stochastics. This signals a very strong change in investor sentiment.
Some traders are afraid to buy after a significant gap-up. They are afraid that they are buying at a high. Remember, if the stochastics are rising and the candlestick is above the T-Line, then the upward trend is likely to continue. Bear in mind that the further the candles drift north of the T-Line, the more likely they are to retrace and come back to it. Bullish kicker Signals don’t require a gap-up as long as it is a significant move in the opposite direction of a downtrend, and it’s moving above the T-Line with supporting stochastics. As a rule of thumb, the bigger the Bullish Kicker Signal is, the more significant the move will be.
Bullish Flutter Kicker
A Bullish Flutter Kicker occurs when the market has a down day followed by an indecisive gap-up. If you see a Doji gapping-up over the previous days open, it’s a signal that the market is showing some strength. If the market moves up the next day over the previous days close and starts moving above the T-Line, it’s a signal that investor sentiment is moving the market into an uptrend. If you remove the Doji from the picture, you would have a Bullish Kicker Signal with a strong gap-up.
Steady Eddie Trends
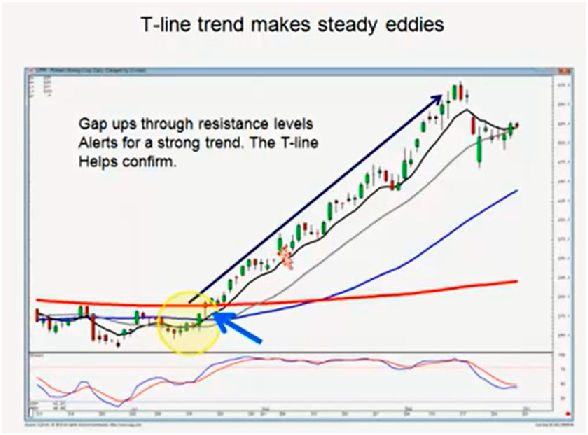
When you see a gap up through a resistance, in this case, the 200-day moving average, it signals the start of a “Steady-Eddie” trend, and it’s a great place to be. The candlesticks will ride above the T-Line for an extended period of time signaling multiple opportunities to let profits ride. You can rest every night knowing that the market will continue to rise until you see a close below the T-Line. Once again, the further the candlesticks drift above the T-Line, the more likely they are to return to the T-Line. Once the Candlesticks start crossing back below the T-Line is when you need to start thinking about making a course correction.
Magnitude of the Signal
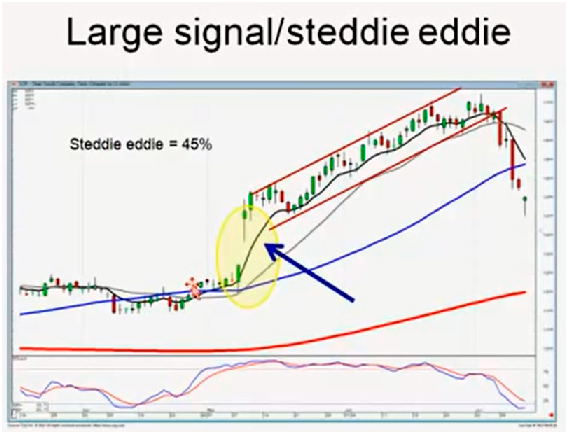
The larger the signal, especially after a Doji, the more compelling the evidence is that there is a change in investor sentiment. In this example, the candles formed a rounded bottom and broke above the 50-day moving average resistance level, followed by a very large gap-up above the T-Line. Once a gap-up like this happens, the market will more than likely form a 45-degree “Steady-Eddie” pattern, where the market churns upward above the T-Line.
Whenever you see a large gap in candlestick patterns as shown above, it’s a sign of a strong move. If you can identify it, your earnings will multiply.
Summary
Candlestick patterns are a historical gauge of investor sentiment. They were developed centuries ago by Japanese rice traders and they still work today. If you study these bullish candlestick patterns and can identify them, you will prepared to act on decisive changes in investor sentiment. You will be in a much better position to enter into an uptrend, set stop/losses and ride your profits to the upside.
The tools you need are simple and straightforward:
Follow the rules in this lesson, and you will trade with better certainty. You will have a better handle on investor sentiment and will know when to enter and exit a trade.
ABOUT THE AUTHOR

Stephen W. Bigalow possesses over twenty-five years of investment experience, including eight years as a stockbroker with major Wall Street firms: Kidder Peabody & Company, Cowen & Company and Oppenheimer & Company. This was followed by fifteen years of commodity trading, overlapped with twelve years of real estate investing. He holds a business and economics degree from Cornell University, and has lectured at Cornell and at many private educational investment functions over the past twenty years.
Mr. Bigalow has advised professional traders, money managers, mutual funds and hedge funds, and is recognized by many in the trading community as the “professional’s professional.” He is an affiliate of the “Market Technicians Association”. (mta.org – A non-profit association of professional technical analysts) and a member of AAPTA, the American Association of Professional Technical Analysts. (aapta.us)
Maximizing Risk and Booking Bigger Profits Are Easy When You Follow Market Phases
Welcome! Whether you are new to trading or have years of trading experience, this e-book is for you because…
This ebook will enable you to identify the best time to enter a trade, and determine which trades have the least amount of risk with the greatest potential for gains.
Trade identification or knowing which instrument to trade can be daunting if you don’t have a simple way to know the true direction of the market.
Many investors are baffled by the media’s scaremongering. Often, confusion lies between the fundamentals of an asset and technical condition of its chart. Both types of analysis often come to totally different conclusions.
The “Gurus” are as varied in their analysis and opinions as there are instruments to look at.
Warren Buffett’s advice for the average person: Look at as many companies as possible and when you find the "bargains" you have to act. He says, "Start turning pages on 1000s of companies and turn the pages twice..."
He believes people should look for these companies themselves since, "The world is not going to tell you about great investments." Buffett believes, "the worst investment you can have is cash.”
Great advice, but very few can actually “turn the pages” once let alone twice and readily comprehend and then decide what to do with the information on those pages.
Does this describe your trading style?
If one or more of those statements describe how you feel about trading, you’re not alone. Trading is not easy, especially if you’ve not found a good source of trading education.
However, all of those frustrations listed above can be avoided when you understand how to read the Phases of the market.
Simply put, a “Phase” is the description of the direction and strength of the market’s trend. It is the “stage in the process” that most traders casually refer to as the market’s trend.
But you’re about to discover more than “trend”.
Your new ability to recognize Phases will enable you "see" the different stages of a trend clearly, and eliminate any mystery of the market’s next move.
There is something even more powerful than identifying a trend, and that is being able to perceive the beginnings and ends of a trend. To be able to do that is to be able to take full advantage of knowing when to be in and when to be out of the market.
Your new ability to recognize Phases will enable you "see" the different stages of a trend clearly, and eliminate any mystery of the market’s next move.
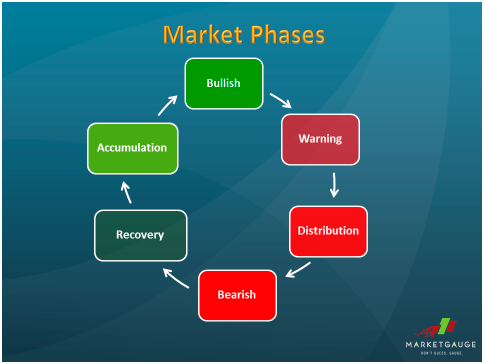
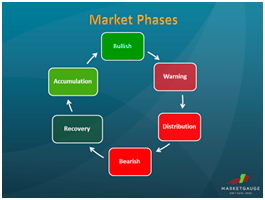
There are 6 market Phases. The above chart illustrates the flow of the 6 Phases in the market.
Most people are familiar with the terms “bullish” and “bearish”, but you can be more precise than that.
If you look at the chart like time on a clock, we begin with the Bullish Phase as High Noon. Moving clockwise from a Bullish Phase, the next phase is a Warning Phase.
Markets may move from a Bullish to Warning Phases as certain economic, geo-political, or even psychological factors spook the market and cause it to decline.
If the market continues to decline, the Phase will deteriorate into a Distribution Phase. When things go from bad to worse, the most negative market condition is the Bearish Phase.
Knowing the Phase and what course of action to take in any given phase is like having your own GPS. This GPS works for the overall market, sectors of the economy, individual stocks, and almost any tradable instrument.
With a GPS, you never feel or get lost because you know your starting point and what direction you need to go next.
Successful technical analysts (chartists) will tell you that the chart precedes the news. Imagine, having the time to prepare for a downturn in advance rather than waiting for some “expert” to tell you that things are worsening.
In addition, picture having a jumpstart on investing or making good financial decisions way before the experts tell you to buy!
Even if you are not tuned in to the “news” or the reaction to the news 24/7, the Phase changes tell you so much; it is actually better than hearing the media or financial experts telling you what is happening. In other words, you will have all the information you need to make decisions, long before the “experts” advise you on the appropriate action to take.
Perhaps the most comforting feature of understanding phases, is that like everything in life, there are cycles. Eventually, everything moves through each cycle.
Often, as you will see later in this book, an instrument might move in between two cycles, going back and forth for a long time before finding momentum in one or the other. The comforting part is that even when everything looks disastrous, you know eventually, conditions and phases will improve.
In 2009, the Real Estate ETF bottomed. By the beginning of April 2009, the Phase changed from Bearish to a more positive Recovery Phase. This was a strong signal.
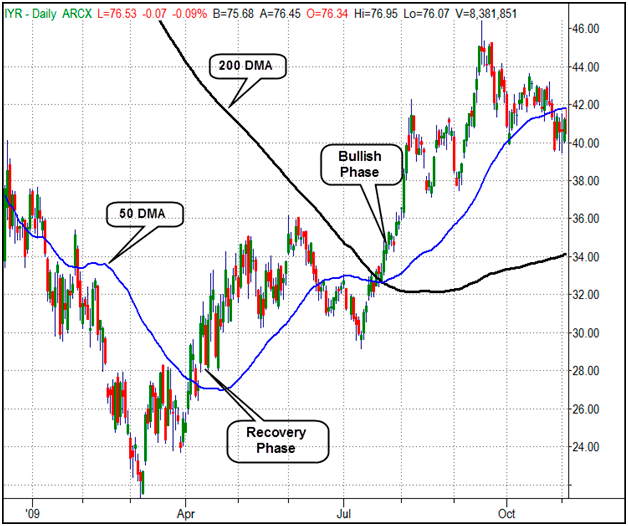
Perhaps some of you were following, but if you weren’t, that turned out to be the BOTTOM of the Real Estate meltdown and the bottom of the stock market for the next 6 years and counting!
Were the pundits telling you that? Was your Financial Planner helping you scope out cheap real estate deals? Were you prepared at all for perhaps the best opportunity in the real estate sector in this century?
Perhaps you saw this headline:
Industry | Wed Jun 24, 2009 2:02pm EDT
U.S. commercial property market thawing
(Reuters) - The gap between U.S. commercial property buyers and sellers is narrowing, indicating the shattered market is closer to beginning the painful path to recovery, the head of Prudential Real Estate Investors said on Wednesday.
Would you have believed this useful news story given that most Financial Planners and Money Market Managers were in the throes of Post-Traumatic Stress Disorder?
You might have if you looked at the Real Estate ETF chart and could independently recognized the Phase Change to Recovery - and a great one at that!
Forecasting direction naturally, is open to interpretation. Experienced investors who use technical analysis will use a variety of indicators besides moving averages.
For our purposes, I have found that keeping analysis simple is the easiest way to understand how predictions are made regardless of how much experience you have.
The constant blast of information available to anyone and everyone goes beyond overkill. Then add interpretations or “opinions” and it leaves you feeling numb, confused and alienated.
The moving average may be the most universal of all technical analysis indicators. For our purposes, we use the simple 50 and 200-day moving averages to determine any and all of the 6 Phases.
The 50-day moving average (“50 DMA”) is calculated by summing up the past 50 closing prices points and then dividing the result by 50, while the 200-day moving average is calculated by summing the past 200 daily closes and dividing the result by 200.
The 200-day moving average may be the granddaddy of moving averages. Simply put, a financial instrument that is trading above it is healthy; below it, anemic. The 200-day moving average measures the sentiment of the market on a longer term basis. This is where major players like pension plans and hedge funds need to look in order to move a large amount of stocks.
Imagine, just 2 simple daily moving averages can help you make the best trading decisions of your life, whether you are a day, swing or options trader!
The 50 DMA describes recent price trend; the 200 DMA describes longer term price trend. By examining current price in relation to these MAs, and the averages in relation to each other, we have an excellent toolkit for analyzing trends.
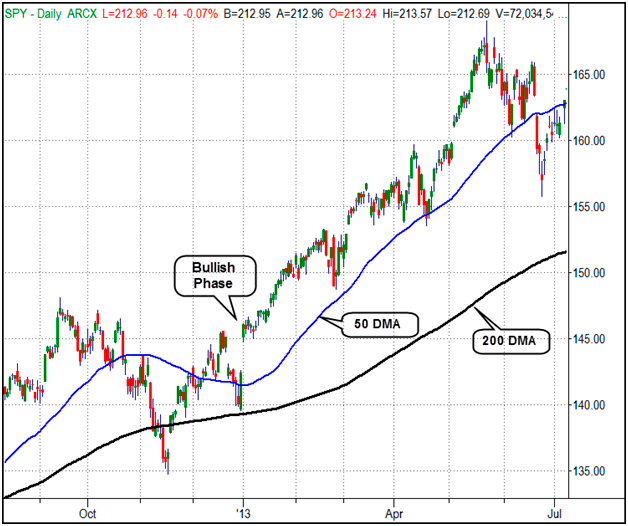
The S&P 500 (SPY) Bullish Phase Change in 2013
How Do You Identify a Bullish Phase?
In the above S&P 500 ETF or SPY chart, as 2013 began, all 3 criteria to confirm the Bullish Phase were in place. The 50 DMA was above the 200 DMA, the slope turned from neutral to positive, and the price was above both of the moving averages.
Literally, the first day of 2013, the price began sitting right on the 200 DMA and then proceeded to climb above it. On the second day of the year the price gapped higher, but it was still close enough to the 200 DMA that a Phase Change trade made sense.
If you had bought the S&P 500 or SPY anytime that first or second week of 2013, you still had time to use a decent risk to under the 200 DMA. You would have been buying around $145.00, risking around $5.00 to under $140.00. Even if you took the profit in June, once it broke the 50 DMA, you still made over $25.00 on that investment with just an initial risk of $5.00. That’s a profit that is 5 times the risk.
The chart below of the TLTs show that in late June of 2011, the Phase changed to bullish in the most powerful way.
Where I have highlighted, the 50 DMA crossed over the 200-day moving average in what is called a Golden Cross. When an instrument gets a Golden Cross, it indicates a bull market is on the horizon.
Looking at the 3 criteria for a Bull phase, the TLT chart certainly fits all 3 perfectly.
Interest Rates are easily followed by looking at the ETF TLT or The 20-Year Treasury Long Bonds.

Naturally, all phases fade in time, which is when we see the cycle go from bullish into warning, then distribution and eventually to bearish.
However, using the same 3 criteria for identifying a bullish phase:
You will always be one step ahead in planning your trading strategy.
Furthermore, after you determine the phase, you will be more informed than most traders and “experts.”
The S&P 500 (SPY) Bear Market of 2007-2009
Paul Tudor Jones, founder of Tudor Investment Corporation, a private asset management company and hedge fund and ranked as the 108th richest American and 345th richest in the world, was asked during an interview, “How do you determine the trend?”
He answered, “My metric for everything is I look at is the 200-day moving average of closing prices. I’ve seen too many things go to zero, stocks and commodities. The whole trick in investing is: “How do I keep from losing everything?” If you use the 200-day moving average rule, then you get out. You play defense, and you get out.”
The interviewer went on to ask, “You exited your long positions before the (1987 Crash)! Did your theory about the 200-day moving average alert you to that one?”
Paul Tudor Jones’ answer, “You got it. It had gone under the 200-day moving target. At the very top of the crash, I was flat.”
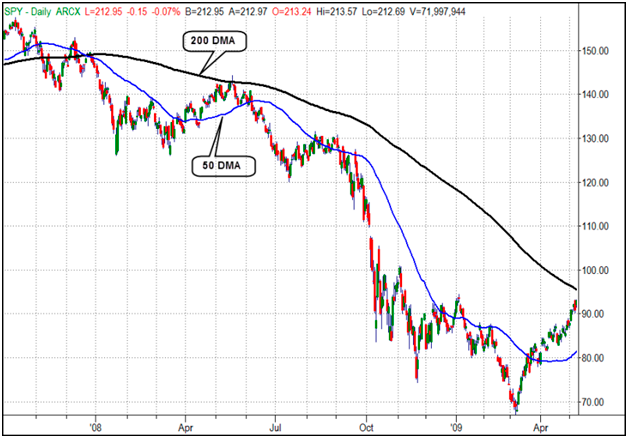
How Do You Identify a Bearish Phase?
During a Bearish Phase, heightened selling pressure ensues. Price closes below the 50 and 200 DMA and the 50 DMA turns down beneath the 200 DMA.
Without having to be one of the richest people in the world, you could have applied this same tactic at the end of 2007 and avoided the historic market decline in 2008
Paul Tudor Jones gave us the example of the 1987 crash and how he exited his long positions based on the move below the 200 DMA in the stock market.
Without having to be one of the richest people in the world, you could have applied this same tactic at the end of 2007 and avoided the historic market decline in 2008. As you can see in the chart above, the SPY fit all 3 criteria of a Bear Phase.
The best time to enter a trade with a low and reliable risk set up is when the price is sitting close to the moving averages as a Phase Change is about to occur.
Close to the end of 2007, just as the S&P 500 chart began entering the Bear Phase, the price was trading between $145.00 and $150.00. Investors had a chance to liquidate their long positions. You also had a choice to go “short” the SPY with a minimal risk as the price stayed close to the moving averages until later on in January 2008.
Had you gone short just under $145.00 as 2008 began, the risk was just over $150.00 or $5.00. Although by 2009, the price traded above and below the 50 DMA, it wasn’t until April 2009, the slope on the 50 DMA turned positive. At that point, the price was $77.00.
Knowing how to trend trade using Phases, could have yielded you a HUGE profit of about $70.00 with only a $5.00 initial risk. That’s a risk/reward of 15 to 1!
If the goal is to Minimize Risk and Book Bigger Profits Using the Phase changes, a short position back in 2008 generated the type of gains most wait a lifetime for and never achieve.
Trading Phases, you can score huge gains over and over again with easily defined, low risk trades!
Note that just as 2008 began, the 50 DMA crossed below the 200 DMA. This is the mirror image of a “Golden Cross” during the Bullish Phase. When the 50 DMA drops below the 200 DMA it is called a “Death Cross.”
With the slope of the 50 DMA very negative and the price below it and 200 DMAs, even the novice investor to clearly “see” that the market was in trouble.
Imagine, having the time to prepare for a downturn in advance rather than waiting for some “expert” to tell you that things are worsening.
Going back to the cycles of how Phases move, the Recovery Phase happens to be one of my favorites since it taps into perhaps the greatest attribute of us humans-hope!
After 2007-2008, during the intense Bear Phase, the switch into a Recovery Phase also tapped into exactly that - hope. Hope that the economy would improve, hope that the 2008 was truly, “the darkest period before the dawn.”
Looking at the SPY chart, by March 2009 the price crossed over the 50 DMA. By April the slope on the 50 DMA turned positive. Then in July 2009, the 200 DMA also became positively sloped.
Once all three criteria of the Bull Phase were in place the market’s trend was steadily up, and it was clear that the worst was over for the S&P 500. The Bullish Phase is one of the first trend conditions that active investors learn to trade because it is typically characterized by reasonable corrections and steady rallies, but the Recovery Phase is one of my favorites.
One of the most powerful times to buy an instrument is after it’s been in a long and powerful downtrend and begins to turn up, entering into a Recovery Phase. The change from a Bearish to Recovery Phase is a way to get into major trends early.
The change from a Bearish to Recovery Phase is a way to get into major trends early.
During a Recovery Phase, the 50 DMA is still below the 200 DMA. The price of the instrument crosses above the 50 DMA and the slope begins to neutralize. As the slope turns more positive, so does the strength of the Recovery Phase.
In the chart below you’ll see an example of a Recovery Phase Trade in the Russian ETF RSX. After a long decline RSX traded over the 50 DMA in February of 2015, and then its slope turned up in March which adds strength to a Recovery Phase trade.
The low risk trade opportunity occurred after RSX declined and closed under a positively sloped 50 DMA in March of 2015. When it quickly traded back over the 50 DMA, moving back into a Recovery Phase it became a good candidate for a trade.
Buying The Russian ETF (RSX) During A Recovery Phase The Russian Stock Market (RSX)
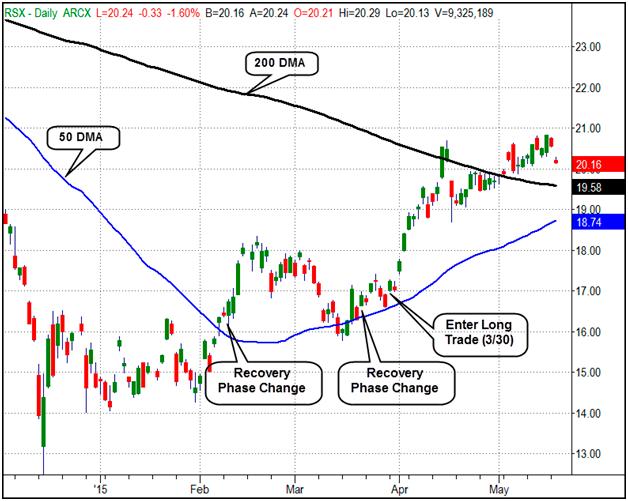
On March 30th 2015, we entered long the Russia Country Fund ETF at $17.26. Our risk was minimal. We risked to $16.50 or 0.76%, which was just under the 50 DMA.
On April 16th, we took a profit target at $20.67, booking $3.41. Simply buying during a Recovery Phase when the price was close to the 50 DMA, kept our risk to a minimum and, gave us a risk to profit ratio of nearly five to one!
As of mid-May, we were still holding a partial position with a profitable trailing stop!
Using Market Phases to analyze the markets and identify trading opportunities is not hard. You can begin with the basics I’ve outlined here, and then quickly develop an expert’s insight into market direction with some practice.
Let’s review:
The Special Offer
To Learn And Earn More
If you’d like to learn more for your trading and earn more in your investing by using MarketGauge’s favorite strategies and tactics including Market Phases, please use the link provided below.
Use the link below to gain access to special training and discover how to:
FOR A LIMITED TIME!
Click here to find more training and a special offer
ABOUT THE AUTHOR

Michele Schneider, Director of Trading Education and Research for MarketGauge.com, began trading on the floor of the NY Commodities Exchanges in 1980.
“Mish” worked for Conti-Commodities, a division of Continental Grain as an analyst and floor broker.
Soon thereafter, she became an independent floor trader. Known for her charting skills and technical analysis expertise, she has advised and continues to advise some of the top traders in the world.
In 2009, Mish created, “Mish’s Premium Service, a complete trading system for investors to f
INTRODUCTION
Success as a trader does not come down to predicting the future with 100% accuracy. Instead, it's a result of consistently identifying - and trading - high probability opportunities that risk a small amount of capital for the potential of a larger gain, usually a multiple of the capital risked. The goal thus becomes identifying opportunities with a higher probability of returning the reward (profit) than the loss that would occur on a predetermined stop-loss. While there are dozens, if not hundreds, of low-risk, high reward opportunities, I wanted to focus your attention on one of my favorite set-ups that fulfills these criterion: low-risk, high-reward, greater chance of a successful outcome.
In general, strategies that take advantage of trends in motion - "pro-trend strategies" - test out better than anti-trend strategies that fight a trend. While reversal or "fade" strategies may have their place in a trader's toolbox, new traders often do best by focusing on simple strategies that capitalize on a price trend in motion.
One of the best strategies a new and developing trader can employ is a simple retracement strategy. Retracements take advantage of a trend in motion by generating a buy signal as price "pulls back" or retraces to a support level during an ongoing trend. Once a trend is in motion, odds tend to favor continuation of the trend as opposed to reversal. While it's tempting to expect a trend to reverse, data and trading experience do not back up reversal strategies as the best approach, especially for new traders. While there is only one actual reversal spot in a trend, there are often plenty of opportunities to buy pullbacks or retracements during the development and continuation of a trend in motion.
PRESENTATION
General Description:
Momentum precedes price, and this pro-trend retracement set-up is based on that principle.
We must FIRST observe a clear New Momentum High as well as a New Price High (or Low, in terms of the Impulse Sell), and then note that as our INITIAL CONDITION. Once we observe these TWO variables occur simultaneously, we WAIT PATIENTLY for a pull-back (retracement) in price, usually to the 20-Period or 50-Period Exponential Moving Average.
Once price has made a new momentum high, pulled back to the rising 20 (or sometimes 50) period moving average, we then wait for the TRIGGER which will pull us into the market for a type of “Swing” trade or “Scalp” trade where we play for a RETEST ONLY of the previously established price high.
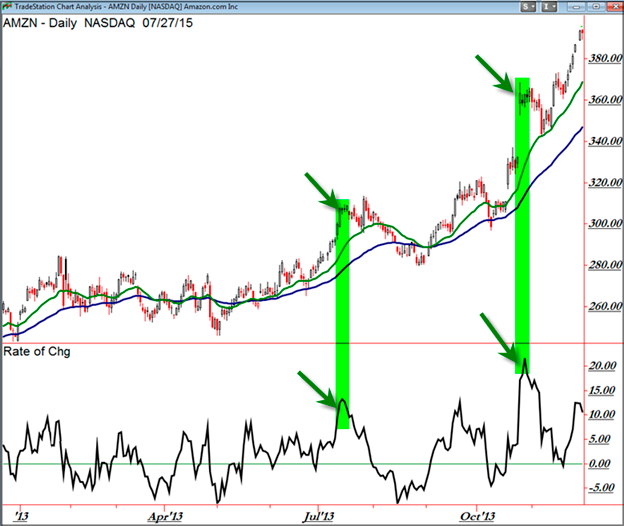
Figure 1: Amazon.com (AMZN) showing two new price highs confirmed with new momentum highs.
In the chart of Amazon.com (AMZN) above, we see two examples of the "New Price High with New Momentum High" condition. We're using the standard Rate of Change (RoC) indicator which is available on most charting platforms. While it's easy to spot a new price high in an ongoing trend, we must look for a new indicator high in the momentum oscillator to confirm the new price high. In real-time, compare the value of the indicator to the previous peaks during the uptrend in price. If price - in an uptrend - makes a new high, we look for confirmation from momentum as it also makes a new indicator high along with price. It helps to draw a vertical line connecting the price high with the momentum high. Note the two highlighted examples in the uptrend of Amazon.com (AMZN) during 2013.
In addition to momentum (the RoC Indicator) making a new high along with price, you can look to Volume to confirm a new price high as well.
Note the spike or increase in volume at the same time Amazon.com (AMZN) shares pushed to new swing highs during an ongoing uptrend. These occurred at the same time the new momentum highs occurred.
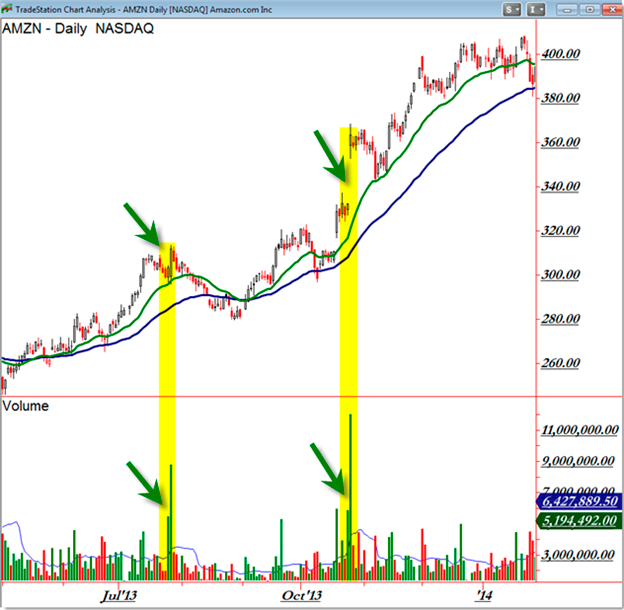
Figure 2: Amazon.com (AMZN) in an uptrend. New Price Highs are also confirmed with spikes or increases in Volume.
Logic:
If momentum precedes price, then a new momentum high (identified in a momentum oscillator) should lead to a new price high more times than it leads to a new price low. This is the ‘greater than 65% win’ condition that allows us to quantify this set-up, and it allows us a framework to place and manage a trade.
We do not enter at the new momentum high, because odds then shift to favor a swift retracement against that new price high as profit takers sell positions and aggressive, but unaware, traders establish short-sell trades, diminishing demand and increasing supply.
We wait for a retracement because we expect price to swing back upwards and at least retest the most recently established price high.
We play for a small target, and play for a RETEST of the NEW HIGH ONLY, rather than trying to ‘get greedy’ and play for an entire ‘swing leg’ up in price (which often will unfold). Often, price will swing above the most recent price high, and it is perfectly fine to leave at least half of the position on to play for the new price high, but research shows that the greatest odds LONG TERM will come from playing for the retest of the high ONLY.
The Tools You Will Need:
For spotting and trading the "Impulse Buy" specific retracement set-up, you'll need to use a price chart of bars or candles (I prefer candle charts but simple bar charts are sufficient).
20 Period Exponential Moving Average:
A short-term moving average. Look for a steadily rising 20 period EMA as a bullish uptrend continues. EMAs can be used to confirm trends in motion and to enter a trade at a pullback to a rising average. In a strong trend, price will pull back (retrace) only to the rising 20 period EMA and then "bounce-back" or rally up off this average. We want to position our trade with low risk in the event that buyers do step in and rally this price up off this potential support level (think of it like a self-adjusting, rising trendline).
50 Period Exponential Moving Average:
An intermediate term moving average. Similarly, the 50-period EMA should be rising during an uptrend in price. A steeper pullback may find support at the rising 50 EMA, but we generally prefer taking trades into the rising 20 EMA. The 50 EMA is often a good indicator to use as a stop-loss level, placing a stop-loss under the 50 EMA and trailing the stop higher as the 50 EMA trends higher. While the 50 EMA can be an entry trigger to buy, it's often best used as a level for which to trail a stop. Think of it as the "last line" of defense for buyers to enter and "bounce" the market up off support.
A Momentum Oscillator:
There are many ways to measure "Momentum" in the market. Keep in mind that "Momentum" is a concept and not necessarily an exact trigger as would be the case for a cross-over trigger (like an indicator crossing above or beneath a zero-line). We look to the momentum oscillator as confirmation only, not a trigger for entry. The standard Rate of Change (RoC) indicator is accessible to traders through most charting platforms or websites. The default period is 14.
Indicators such as the 3/10 MACD Oscillator, indicator named "Momentum," and other advanced indicators may be used as you develop experience with this concept and want to move beyond the basics.
Entry
Price MUST make a new high and momentum must make a new high for the Impulse Buy Trade.
For the Impulse Sell Trade, Price must make a new LOW and momentum must make a new LOW.
We wait for the retracement to the rising (or falling) 20 period exponential moving average, and then when price ‘hits’ this area, we establish a position either at the market, or with a limit stop order to take us into the market (long or short) when price reaches this level.
Alternatively, you could wait for price to test the rising 20 period moving average and wait for an “Up-Bar” or “Up-Day” before establishing your position. You could also demand that the ‘Up-Bar’ take out the price by at least one penny of the last one or two candlesticks or bars, to give you greater confidence that the upswing is occurring.
There is a window of entry in this trade. If you enter BEFORE price tests the rising 20 period moving average, you would be entering aggressively, which is fine because sometimes price does not touch the moving average exactly, as many traders will by scurrying to buy (or short-sell) at this zone. You may actually make more money in the long-term doing this, because you would be getting in early, but sometimes the price may collapse through the moving average, leaving you with a loss that wouldn’t have occurred had you waited for confirmation.
If you enter AFTER price tests the rising 20 period moving average, your win rate will likely be higher but you will make less money because you will be entering fewer trades and capturing a smaller piece of the eventual price action. Here is a real-time example: two touches of the rising 20 day EMA and thus two BUY trade entries in Amazon.com (AMZN):
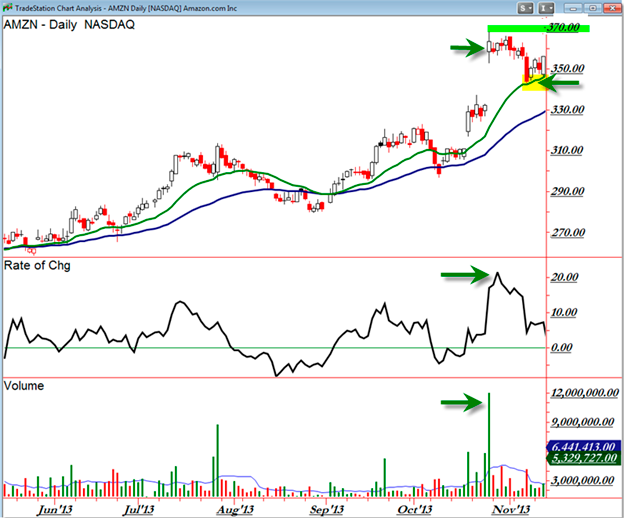
Figure 3: Amazon.com (AMZN) demonstrates a New Price High, New Momentum High, and Spike in Volume in late October 2013. Traders had two opportunities to BUY as price retraced and touched the rising 20 day EMA in November. The simple price target was the prior high near $370.00 per share.
Target:
Again, it is tempting to play for a ‘whole new leg’ or ‘entire swing’ in price, but odds favor that price will at least retest the most recent price high or low. Odds drop off when playing for a target beyond the most recent price high. The longer a swing in price endures, the greater the odds are for a reversal. By exiting before we expect price to peak, we not only lock in a profit, but we are “Selling” when others are clamoring to “Buy” because they just can’t stand sitting on the sidelines any longer. You will sometimes incur ‘negative slippage,’ meaning that if a move is strong and you place a sell-stop order out there, you might get filled at a level higher than you anticipated (which is exactly the opposite when you are selling when everyone is buying, or vice versa).
Stop-Loss
We will allow price to trail slightly below the rising or falling 20 period moving average, in order for the market makers to ‘play games’ and take out the weak stops that cluster predictably beneath key levels of support and resistance. Generally, you want to place your stop at least one ATR (Average True Range) value beneath the exact value of the 20 period moving average, provided that number is not a ‘round number’ such as $43.00 or $33.50. If so, go a ‘strange number’ below that zone, such as $42.91 or $33.44, to give yourself room to avoid a slight break under the exact level.
With stops in positive-expectancy trades, it is best to allow ‘wiggle room’ and not place stops too conservatively. With these trades, your profit target is defined by the price structure, so you want your stop to be ideally at least one-third of your profit target. For example, if you are playing for a $6 target, place your stop around $2, given what the daily Average True Range is for the stock. It is sometimes best to give yourself TWO average true ranges for a stop value, but no more. If you are playing for a $10 target, perhaps a $3.30 stop beneath the moving average is best, but you can definitely decrease that to $2.00 or so. This is where your own personality and experience comes in to grant you freedom in where you place stops – be it aggressively (larger stops further away) or conservatively (smaller stops closer to entry).
As mentioned earlier, traders may also choose simplicity and trail a stop under the rising 50 period EMA, assuming that if price does break under the rising 20 EMA, it will stop and reverse up away from the rising 50 EMA. If price breaks firmly under the rising 50 EMA, odds shift to favor a reversal and we would indeed need to limit losses in this "reversal" outcome.
The following are examples of textbook Impulse Buy Trades:
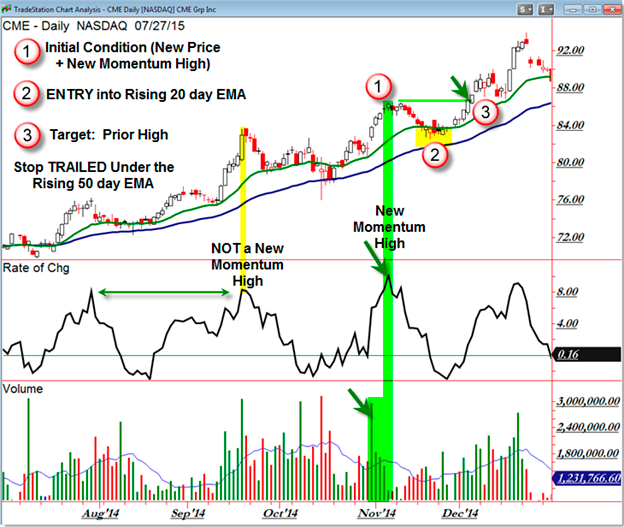
Figure 4: CME Group (CME) Daily Chart. Uptrend in motion. New Price AND New Momentum High in early November 2014. WAIT for the pullback (retracement) to the rising 20 day EMA. The trigger is into the rising 20 EMA (near $83.00) and first target is the prior price high near $86.00 per share. As the uptrend continued, price traded even higher than the target.
The initial condition (#1) occurs when price is uptrending and pushes to a new swing high. The condition for our "Impulse Buy" Trade develops when Momentum - and preferably volume - spike to a new indicator high on the chart which acts as a confirmation of the new price high. Notice that September 2014 saw a new price high but NOT a new momentum high (look closely at the August 2014 momentum high). Once we observe a new price high confirmed with momentum, we want to enter on the first pullback to the rising 20 EMA. This occurs in mid-November 2014 toward the $84.00 per share level. Our stop-loss is placed - and trailed - under the rising 50 day EMA (blue in the chart above). Notice how in this example price does trade slightly under the 20 EMA but NOT under the 50 EMA - that's where we want our stop. It's ok if price doesn't instantly bounce up off the 20 day EMA.
Finally, our Target (#3) is simply the prior swing high which occurred near $86.00 per share. As mentioned, you can exit the full position here as price touches the target, or if you're more aggressive, you can take profits on half of your position and hold half until price breaks under a reversal candle or on the first "down" day or sell-candle (bar) on the chart.
Yahoo! (YHOO) reveals two Impulse Buy retracement set-ups during an uptrend in 2013:
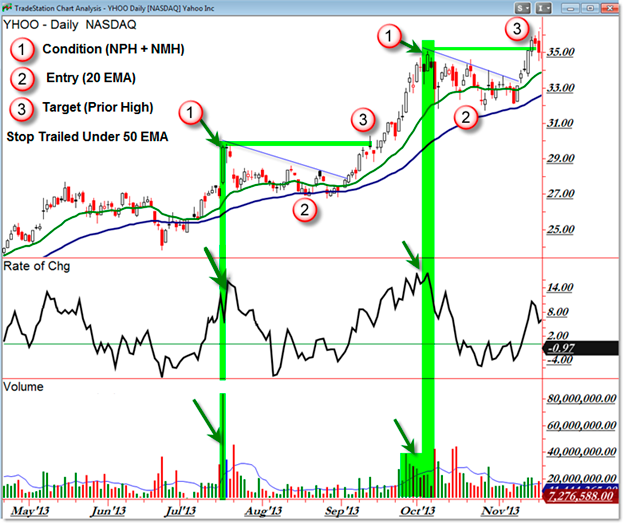
(Figure 5: Yahoo! YHOO Demonstrating Two Impulse Buy Trades in 2013)
The Impulse Buy Trade has a clear rhythm: Initial Condition, Retracement, Buy, Stop-Loss Placement, Target.
The initial condition is a new price high occurring in an ongoing uptrend in price. We then look to momentum to confirm a new price high with a new indicator (momentum) high and if so, we have our initial condition. We then wait for price to pull back (retrace) to the rising 20 day EMA and then buy as price touches the 20 EMA. Our stop-loss is then placed and trailed under the rising 50 period EMA and then we wait. Either price will break lower, causing a failed trade and a stop-loss trigger outcome (small stop) or else buyers will enter at a low-risk pivot level, causing price to rally up at least as high as the prior swing high and then likely beyond that. As traders, we simply want to be clear with our entries, management, and exit and capture the high-probability swing. The stop is smaller than the distance to the target which is the prior swing high. The key is patience and being objective with these parameters.
CONCLUSION
The "Impulse Buy" Trade is a special type of pro-trend retracement opportunity that relies on an initial condition to generate an entry, target, and stop-loss level for us to trade. Depending on the distance of the retracement, the stop will often be two or three times the distance to the target (prior price high). With that logic, we have a small risk at the same time we have a larger profit target.
Our rules help us stay on the right side of probability and thus limit our losses when price fails to reverse up off the moving averages. Not every trade can be perfect, but the key is finding higher probability outcomes that allow for a small risk (distance from entry to your stop) at the same time it offers a larger profit potential (distance from entry to your pre-defined target).
THE MOVIE
The Impulse Buy Trade is just one of the many specific trade set-ups we teach and employ daily at Afraid to Trade, WATCH THE VIDEO HERE for more details on how you can fill 5 gaps in your trading.
THE SPECIAL OFFER
Download four in-depth lessons on how to apply this simple, effective retracement strategy to your successful trading activities.
To learn more and receive a copy of the special “Trend Trader Tactics”, for only $27.00, SIMPLY CLICK HERE!
ABOUT THE AUTHOR

Corey Rosenbloom’s interest in the stock market began as a junior in High School where his team won an investment challenge competition which drew him into investing actual money in the market using basic fundamental analysis. Later, the Bear Market of the early 2000s would challenge these assumptions and force him into deeper study of market concepts – “There had to be a better way than Buy and Hold strategies.” He was soon introduced to the concepts of price charting, or more formally known as “Technical Analysis” and the pattern recognition, along with indicator combinations, drew his attention sharply in that direction. As the market began its recovery, he was participating as a momentum intraday trader, which soon gave way to broader swing-trading strategies. He describes one of many “light-bulb” moments when he was introduced to Sector Rotation Concepts which seemed to make the price charts fit into a logical progression of expectations. From there, he deployed options trading strategies which gave way to ETF trading, which itself finally gave way to active futures market trading tactics.
Mr. Rosenbloom holds a bachelor’s degree in both Psychology (cognitive research focus) and Political Science, and later received a Master’s Degree in Public Affairs with a Business concentration. He has completed Levels I, II, and III of the Market Technician’s Association’s Chartered Market Technician (CMT) program and is awaiting the official charter in early 2009.
He currently serves as an independent consultant, analyst, author, and educator. He manages both personal and family accounts using the concepts discussed here, employing both long-term and active intraday trading strategies.
One of my all-time favorite technical indicators that I rely on consistently is the Exponential Moving Average Indicator
The EMA proved much more responsive to short term price fluctuations and demonstrated better response to momentum and volatility. You can see by looking at the chart below, how much more responsive the EMA can be compared to the SMA.
Please keep in mind that although I’m demonstrating this method with stocks, it applies to futures, commodities and currency markets just as well. And if you are a day trader, you can change the bars from daily to 5 minute and apply this method to E-mini Futures Contracts as well.
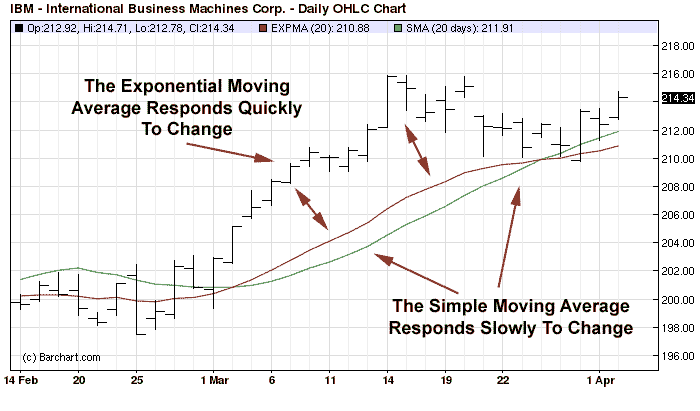
Notice How Much Faster the EMA Responds To Volatility
The Set Up
After demonstrating the effectiveness of the EMA compared to the SMA I adjusted the EMA to 20 look back twenty days. This gives me a good time frame and makes the EMA more responsive to short term market swings. You can experiment with different settings but I suggest you start off with the 20 day.
After adjusting the EMA to 20 days I demonstrated the precise entry method that we will use to enter the market using the 20 day EMA. The basic principle is to use the EMA to measure pullbacks away from the trend. We simply find a stock that’s trending strongly above the EMA, the more distance between the stock and the EMA the better the trend.
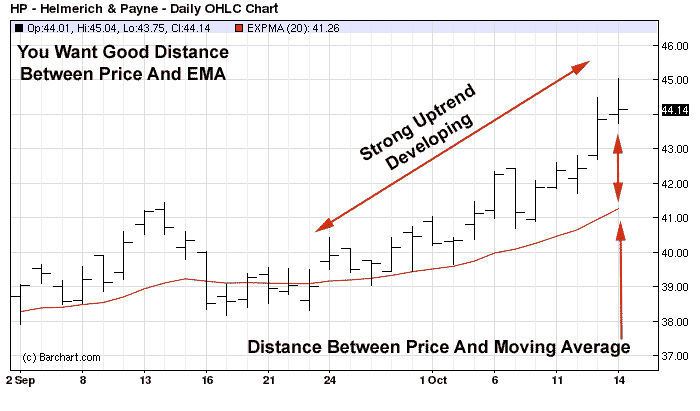
Look For Markets That Are Trending Strongly Above the EMA
The next step is to wait for the stock to trade completely below the EMA for 5 days or less. If the stock trades below the EMA for more than 5 trading days the trade is nullified and if the stock trades completely above the EMA within the 5 trading days you would enter a buy stop order above the first bar that trades completely above the EMA.
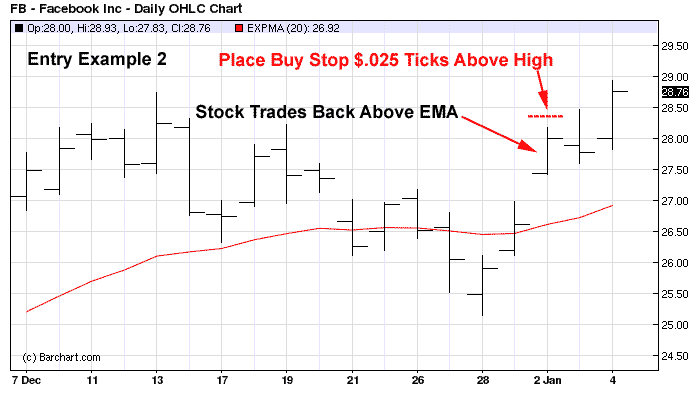
The Stock Only Traded One Day Below The EMA – Remember 5 Days Max
Placing Protective Stop Loss
The final step we covered yesterday was where to place your stop loss level so that random price fluctuations or market noise doesn’t cause you to be stopped out prematurely. My advice is to place your stop at the EMA level immediately between the last bar that traded completely below the EMA and the first bar that traded completely above the EMA. This may sound a bit confusing so take a look at this example for clarification.
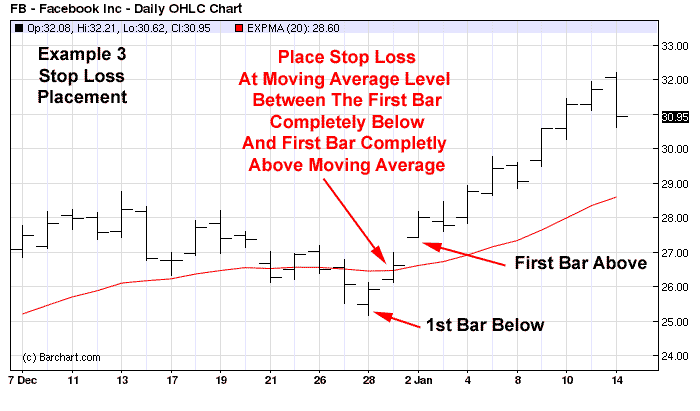
Place Your Stop Loss at the Exact EMA Level Between The Two Bars
Where to Place Your Profit Target
The final step is to strategically place your profit target and that’s something we will cover in today’s tutorial. You want to make sure and place your profit target at a level that provides you with a solid risk to reward level. Most professional traders use a profit to risk ratio of two to four. This means for every dollar you risk you should profit anywhere from two to four dollars.
This particular method is based on short term price momentum and volatility, therefore using a profit target that’s designed to keep me in the market for a long time will not work with this type of strategy. A good tip is to always plan your exits based on the characteristics of your entry method. I use a simple two to one risk level with this strategy. I want to see very strong momentum coming into the market as quickly as possible after I enter my order.
I simply measure the distance between my entry price and the stop loss level and multiply that number by two. I then add that amount to my entry price and that becomes my profit target for the trade. This ratio offers me a reasonable risk to reward ratio and provides me with an opportunity to take quick profits from the increase in volatility before the momentum dries up once again.
In this particular example the distance between my entry price and my stop loss level was approximately $2.25 cents. I would multiply that number by two and add that amount to my entry price, which in this particular case was $28.60. I then add $28.60 to $4.50 and my profit target in this particular case would be $33.10.

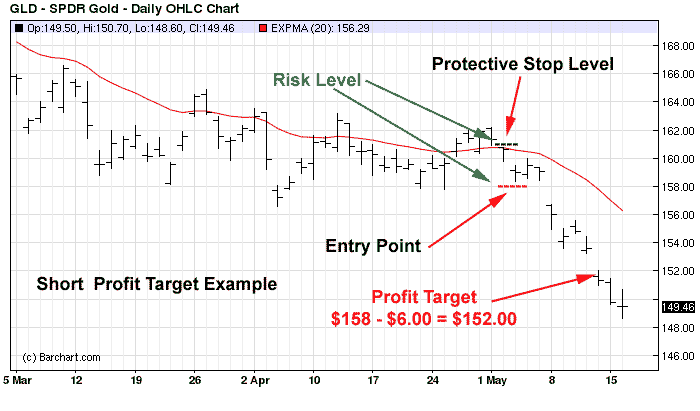
In this final example you can see exactly where the entry and the protective stop loss level are placed. Since we are selling short we would subtract our risk level from our entry and that would provide us with our profit target.
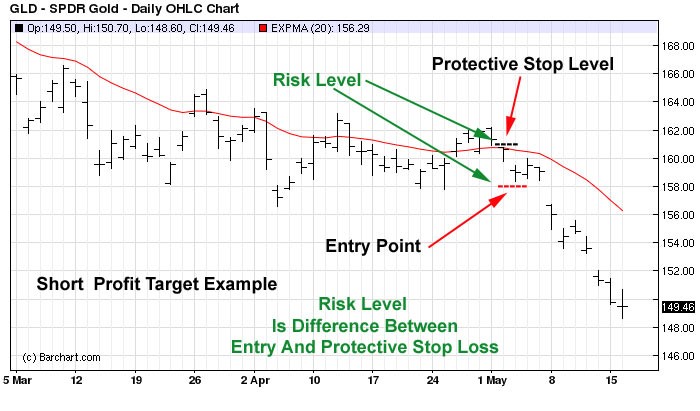
Subtract Your Risk Level From Your Entry Price
In this particular case the risk level on the trade equals $3.00. We would multiply that number twice and subtract it from our entry price. Since our entry was at $158.00 and our risk level was $3.00 we would subtract $6.00 from our entry price and that would provide us with a profit target level of $152.00 even.
Things to Keep In Mind
Always remember that pure momentum strategies that are based on volatility have lower profit to loss ratio than other technical trading methods.
Also remember that the 20 bar EMA can be adapted to any market and time frame. The only market I don’t recommend you trade using this method is options. If you want to learn more about this strategy or have any questions, please don’t hesitate to contact me at [email protected].
All the best,
Roger Scott
Senior Trainer, Market Geeks
THE SPECIAL OFFER
If you would like to learn more about technical strategies that I've created over the years, please follow this link.
ABOUT THE AUTHOR

Market Geeks, LLC was founded in 2005 by a group of professional traders led by Roger Scott, a professional trader and a successful entrepreneur with over 20 years of experience in the financial markets industry. It all started when a college friend introduced Roger to short term stock trading in the early 90’s. After a few weeks of following the stock market over his friends shoulder, Roger knew that he found his true passion in life.
Mr. Scott continued trading while attending college and later law school, earning his law degree in the process. Roger remembers the times he would excuse himself from class lectures and run downstairs to the payphone to call his stock broker for quotes.
Shortly after completing law school and spending many years simultaneously studying advanced technical analysis, risk control, money management and systematic trading, Mr. Scott became a successful futures broker and a hedge fund manager, with experience trading stocks, index futures, commodities, options and foreign currency markets.
In early 2005, Mr. Scott was approached by a group of professional traders who were interested in starting a trading education firm focusing on short term and day trading strategies. The traders were looking for someone who not only had extensive trading knowledge and experience but who could also take complex trading ideas and concepts and communicate them with simple explanations and relevant examples.
This is how it all began 10 years ago, and today Market Geeks, LLC is widely known for providing traders around the world with the very best in short term trading and day trading knowledge and education. We strive to become the finest trading education resource in the world, with the highest level of customer satisfaction.
Quick Description
Ichimoku Kinko Hyo is a purpose-built trend trading charting system that has been successfully used in nearly every tradable market. It is unique in many ways, but its primary strength is its use of multiple data points to give the trader a deeper, more comprehensive view into price action. This deeper view, and the fact that Ichimoku is a very visual system, enables the trader to quickly discern and filter "at a glance" the low-probability trading setups from those of higher probability.
History
The charting system of Ichimoku Kinko Hyo was developed by a Japanese newspaperman named Goichi Hosoda. He began developing this system before World War II with the help of numerous students that he hired to run through the optimum formulas and scenarios -- analogous to how we would use computer-simulated backtesting today to test a trading system. The system itself was finally released to the public in 1968, after more than twenty years of testing, when Mr. Hosoda published his book, which included the final version of the system.
Ichimoku Kinko Hyo has been used extensively in Asian trading rooms and has been used successfully to trade currencies, commodities, futures, and stocks. Even with such wild popularity in Asia, Ichimoku did not make its appearance in the West until the 1990s and then, due to the utter lack of information in English on how to use it, it was mostly relegated to the category of another "exotic" indicator by the general trading public. Only now, in the early 21st century, are western traders really beginning to understand the power of this charting system.
Equilibrium at a Glance
The name Ichimoku Kinko Hyo translates to "Equilibrium chart at a glance." Here’s how it’s used.
While Ichimoku utilizes five separate lines or components, they are not to be used individually, in isolation, when making trading decisions, but rather used together to form an integrated "whole" picture of price action that can be gleaned "at a glance." Thus, a simple look at an Ichimoku chart should provide the Ichimoku practitioner with a nearly immediate understanding of sentiment, momentum and strength of trend.
Price action is constantly measured or gauged from the perspective of whether it is in relative equilibrium or disequilibrium. Hosada strongly believed that the market was a direct reflection of human group dynamics or behavior. He felt that human behavior could be described in terms of a constant cyclical movement both away from and back towards equilibrium in their lives and interactions. Each of the five components that make up Ichimoku provide its own reflection of this equilibrium or balance.
The Ichimoku chart is composed of five separate indicator lines. These lines work together to form the complete "Ichimoku picture." A summary of how each line is calculated is outlined below:
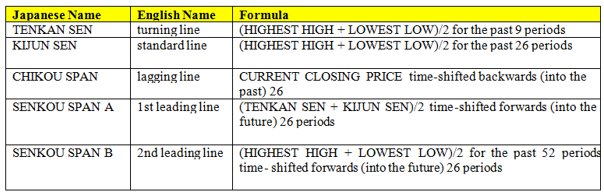
The Senkou span A and B deserve special mention here as they, together, form the Ichimoku “kumo” or cloud. We cover the kumo and its myriad functions in more detail in the kumo section.
The chart below (FIGURE 1) provides a visual representation of each of these five components:
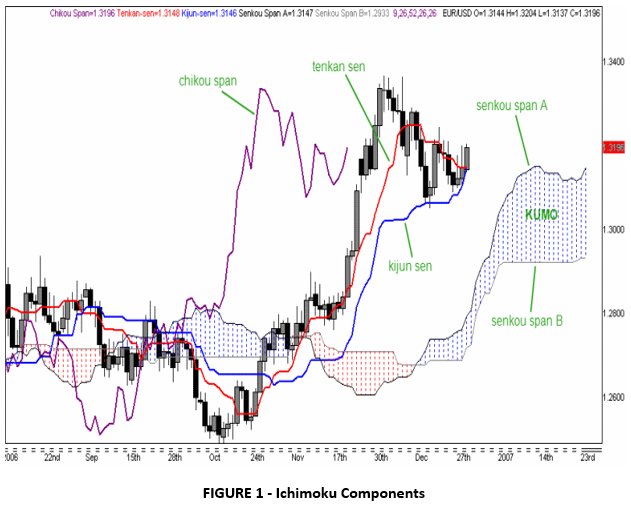
Ichimoku Settings
As you can see in the Ichimoku Components section above, each line calculation has one and sometimes two different settings based on the number of periods considered. After much research and backtesting, Goichi Hosoda finally determined that the settings of 9, 26 and 52 were the ideal settings for obtaining optimum results with Ichimoku. He derived the number 26 from what was then the standard Japanese business month (which included Saturdays). The number 9 represents a week and a half and the number 52 represents two months.
The standard settings for an Ichimoku Kinko Hyo chart are 9, 26 and 52.
There is some debate around whether or not these settings of 9, 26 and 52 are still valid given that the standard work month in the West does not include Saturdays. In addition, in non-centralized markets that do not keep standard business hours like the Forex (which trades around the clock), some have posited that there may be more appropriate settings.
Nevertheless, EII Capital, as well as most other professional Ichimoku traders, agree that the standard settings of 9, 26 and 52 work extremely well and do not need to be altered.
The argument could be made that, since Ichimoku Kinko Hyo functions as a finely-tuned, integrated whole, changing the settings to something other than the standard could throw the system out of balance and introduce invalid signals.
Tenkan Sen
The Tenkan Sen, as mentioned, is calculated in the following manner:
(HIGHEST HIGH + LOWEST LOW)/2 FOR THE PAST 9 PERIODS
While many may compare the tenkan Sen to a 9-period simple moving average (SMA), it is quite different in the sense that it measures the average of price's highest high and lowest low for the last nine periods. Hosoda believed that using the average of price extremes over a given period of time was a better measure of equilibrium than merely using an average of the closing price. This study of the tenkan sen will provide us with our first foray into the key aspect of equilibrium that is so prevalent in the Ichimoku Kinko Hyo charting system.
Consider the chart in Figure 1 below:
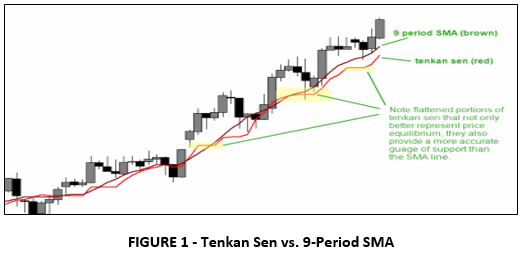
As can be seen in the chart, the tenkan sen often exhibits "flattening" whereas the 9-period SMA does not. This is due to the fact that the tenkan sen uses the average of the highest high and lowest low rather than an average of the closing price. Thus, during periods of price ranging, the tenkan sen will clearly show the midpoint of the range via its flat aspect. When the tenkan sen is flat, it essentially indicates a trendless condition over the last 9 periods.
It can also be seen how the tenkan sen provides a much more accurate level of price support than does the 9-period SMA. With only one exception, price action stayed above the tenkan sen in the three highlighted areas of the chart, while price broke below the SMA numerous times. This is due to the more conservative manner in which the tenkan sen is calculated, which makes it less reactive to small movements in price. On a bearish chart, the tenkan sen will likewise act as a level of resistance.
The angle of the tenkan sen can also give us an idea of the relative momentum of price movements over the last nine periods. A steeply angled tenkan sen will indicate a nearly vertical price rise over a short period of time or strong momentum, whereas a flatter tenkan sen will indicate lower momentum or no momentum over that same time period.
The tenkan sen and the kijun sen both measure the shorter-term trend. Of the two, the tenkan sen is the "fastest" given that it measures trend over the past nine periods as opposed to the kijun sen's 26 periods. Thus, given the very short-term nature of the tenkan sen, it is not as reliable an indicator of trend as many other components of Ichimoku. Nevertheless, price breaching the tenkan sen can give an early indication of a trend change, though, like all Ichimoku signals, this should be confirmed by the other Ichimoku components before making any trading decision.
One of the primary uses of the tenkan sen is its relation to the kijun sen. If the tenkan sen is above the kijun sen, then that is a bullish signal. Likewise, if the tenkan sen is below the kijun sen, then that is bearish. The crossover of these two lines is actually a trading signal on its own, a topic that is covered in more detail in the Ichimoku Trading Strategies section.
Kijun Sen
The kijun sen is calculated in the following manner:
(HIGHEST HIGH + LOWEST LOW)/2 for the past 26 periods
The kijun sen is one of the true "workhorses" of Ichimoku Kinko Hyo and it has myriad applications. Like its brother, the tenkan sen, the kijun sen measures the average of price's highest high and lowest low, though it does so over a longer time frame of 26 periods as opposed to the tenkan sen's nine periods. The kijun sen thus provides us with all the information the tenkan sen does, just on a longer time frame.
Due to the longer time period it measures, the kijun sen is a more reliable indicator of short-term price sentiment, strength and equilibrium than the tenkan sen. If price has been ranging, then the kijun sen will reflect the vertical midpoint of that range (price equilibrium) via its flat aspect. Once price exceeds either the last highest high or lowest low within the last 26 periods, however, the kijun sen will reflect that by either angling up or down, respectively. Thus, short-term trend can be measured by the direction of the kijun sen. In addition, the relative angle of the kijun sen will indicate the strength or momentum of the trend.
Price equilibrium is expressed even more accurately in the kijun sen than in the tenkan sen, given the longer period of time it considers. Thus, the kijun sen can be relied upon as a significant level of price support and resistance (see highlighted areas in Figure II below).
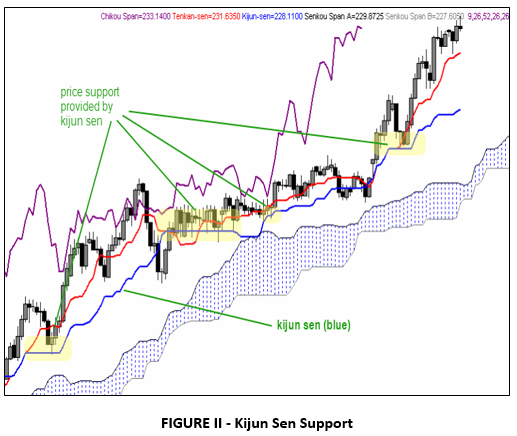
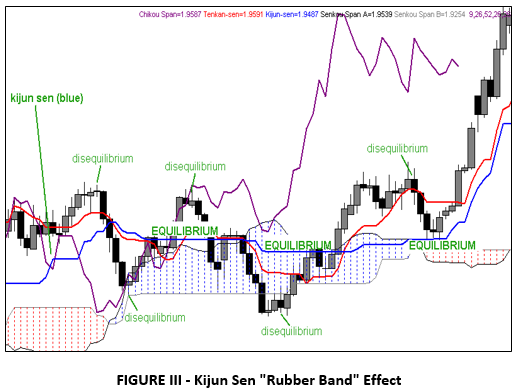
Price tends to move alternately away from and back toward the kijun sen in a cyclical fashion due to the kijun sen's strong expression of equilibrium or stasis. Thus, when price momentum is extreme and price moves rapidly up or down over a short period of time, a certain "rubber band" effect can be observed on price by the kijun sen, attracting price back towards itself and bringing it back to equilibrium.
An analogy could be made between how price interacts with the kijun sen and how electricity always seeks to return to ground or zero potential. The "ground" in this case is the kijun sen and price will always seek to return to that level. This phenomenon is particularly evident when the kijun sen is flat or trendless, as can be seen in Figure III below:
Given the dynamics of the kijun sen outlined above, traders can use the kijun sen effectively as both a low-risk point of entry as well as a solid stop loss. These two tactics are employed extensively in both the kijun sen cross as well as the tenkan sen/kijun sen cross strategies which are covered in greater detail in our Ichimoku Trading Strategies section.
Chikou Span
The chikou span is calculated in the following manner:
CURRENT CLOSING PRICE time-shifted backwards (into the past) 26 periods
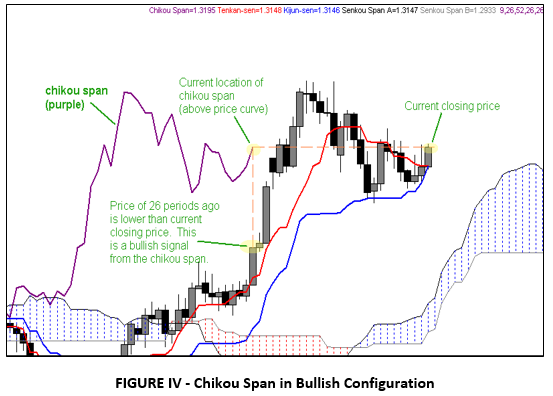
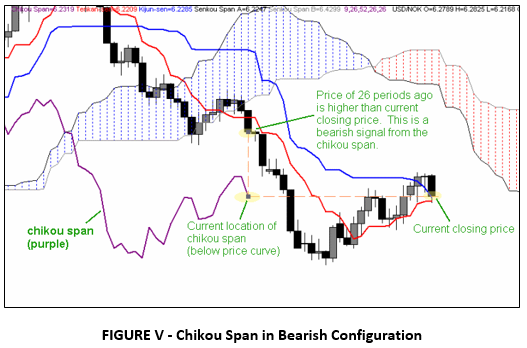
The chikou span represents one of Ichimoku’s most unique features, that of time-shifting certain lines backwards or forwards in order to gain a clearer perspective of price action. In the chikou span's case, the current closing price is time-shifted backwards by 26 periods. While the rationale behind this may at first appear confusing, it becomes very clear once we consider that it allows us to quickly see how today's price action compares to the price action of 26 periods ago, which can help determine trend direction.
If the current close price (as depicted by the chikou span) is lower than the price of 26 periods ago, that would indicate that there is a potential for more bearish price action to come, since price tends to follow trends. Conversely, if the current closing price is above the price of 26 periods ago, that would then indicate the possibility for more bullish price action to follow.
Consider the charts in Figures IV and V below:
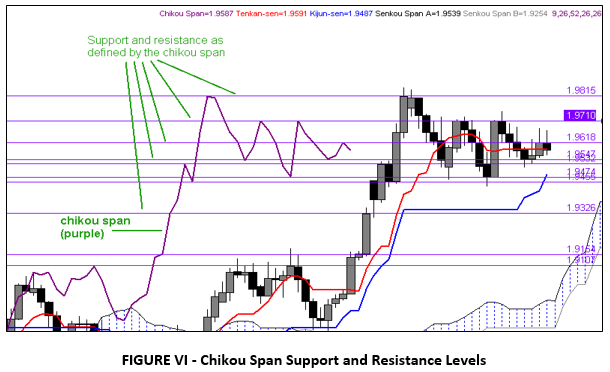
In addition to providing us with another piece of the "trend puzzle," the chikou span also provides clear levels of support and resistance, given that it represents prior closing prices. Ichimoku practitioners can thus draw horizontal lines across the points created by the chikou span to see these key levels and utilize them in their analysis and trading decisions (see Figure VI below).
Senkou Span A
The Senkou span A is calculated in the following manner:
(TENKAN SEN + KIJUN SEN)/2 time-shifted forwards (into the future) 26 periods
The Senkou span A is best-known for its part, along with the Senkou span B line, in forming the kumo, or "Ichimoku cloud" that is the foundation of the Ichimoku Kinko Hyo charting system. The Senkou span A is another one of the time-shifted lines that are unique to Ichimoku. In this case, it is shifted forwards by 26 periods. Since it represents the average of the tenkan sen and kijun sen, the Senkou span A is itself a measure of equilibrium. Goichi Hosoda knew well that price tends to respect prior support and resistance levels, so by time-shifting this line forward by 26 periods he allowed the Ichimoku practitioner to quickly see "at a glance" where support and resistance from 26 periods ago reside compared with current price action.
Senkou Span B
The Senkou span B is calculated in the following manner:
(HIGHEST HIGH + LOWEST LOW)/2 for 52 periods time-shifted forwards (into the future) 26 periods
The Senkou span B is best-known for its part, along with the Senkou span A line, in forming the kumo, or "Ichimoku cloud" that is the foundation of the Ichimoku Kinko Hyo charting system. On its own, the Senkou span B line represents the longest-term view of equilibrium in the Ichimoku Kinko Hyo system. Rather than considering only the last 26 periods in its calculation like the Senkou span A, the Senkou span B measures the average of the highest high and lowest low for the past 52 periods. It then takes that measure and time-shifts it forward by 26 periods, just like the Senkou span A. This convention allows Ichimoku practitioners to see this longer term measure of equilibrium ahead of current price action, allowing them to make informed trading decisions.
While it is possible to trade off of the Senkou span A and B lines on their own, their real power comes in their combined dynamics in the kumo.
The Kumo Cloud
The Basics
The kumo is the very "heart and soul" of the Ichimoku Kinko Hyo charting system. Perhaps the most immediately visible component of Ichimoku, the kumo ("cloud" in Japanese) enables one to immediately distinguish the prevailing "big picture" trend and price's relationship to that trend. The kumo is also one of the most unique aspects of Ichimoku Kinko Hyo as it provides a deep, multi-dimensional view of support and resistance as opposed to just a single, uni- dimensional level as provided by other charting systems. This more encompassing view better represents the way in which the market truly functions, where support and resistance is not merely a single point on a chart, but rather areas that expand and contract depending upon market dynamics.
The kumo itself is comprised of two lines, the Senkou span A and the Senkou span B. Each of these two lines provides their own measure of equilibrium and together they form the complete view of longer-term support and resistance. Between these two lines lies the kumo "cloud" itself, which is essentially a space of "no trend" where price equilibrium can make price action unpredictable and volatile.
Trading within the kumo is not a recommended practice, as its trendless nature creates a high degree of uncertainty.
A Better Measure of Support and Resistance
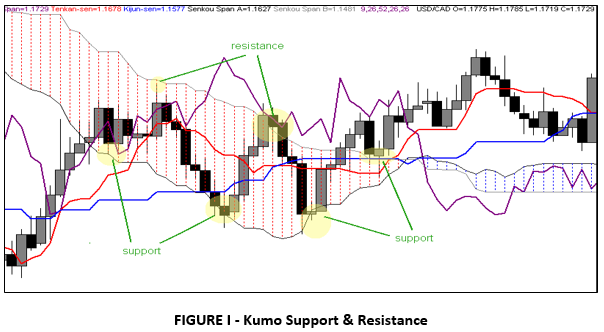
As mentioned earlier, one of the kumo's most unique aspects is its ability to provide a more reliable view of support and resistance than that provided by other charting systems. Rather than providing a single level for support and resistance (S&R), the kumo expands and contracts with historical price action to give a multi-dimensional view of support and resistance. At times the kumo's ability to forecast support and resistance is nothing short of eerie, as can be seen in the chart below (Figure I) for USD/CAD, where price respected the kumo boundaries on five separate occasions over a 30-day span.
The power of the kumo becomes even more evident when compared with traditional support and resistance theories. In the chart for Figure II below, we have added a traditional down trend line (A) and a traditional resistance line at 1.1867 (B). Price managed to break and close above both the down trend line and the single resistance level at point C. Traditional S&R traders would take this as a strong signal to go long with this pair at that point. A savvy Ichimoku practitioner, on the other hand, would take one look at price's location just below the bottom edge of the kumo and would know that going long at that point is extremely risky given the strong resistance presented by the kumo. Indeed, price did bounce off of the kumo and dropped approximately 250 pips, which would have most likely eradicated the long position of the traditional S&R trader.
Frustrated by his last losing trade, the traditional S&R trader spots another chance to go long, as he sees price break and close above the prior swing high at point D. The Ichimoku trader only sees price trading in the middle of the kumo, which he knows is a trendless area that makes for uncertain conditions. The Ichimoku trader is also aware that the top boundary of the kumo, the Senkou span B, is close at hand and may present considerable resistance, so he again leaves this dubious long trade to the traditional S&R trader as he awaits a better trade opportunity. Lo and behold, after meeting the kumo boundary and making a meager 50 pips, the pair drops like a stone nearly 500 pips.
The example given above illustrates how Ichimoku’s multi-dimensional view of support and resistance gives the Ichimoku practitioner an "inside view" of S&R that traditional chartists do not have. This enables the Ichimoku practitioner to select only the most legitimate, high-reward trade opportunities and reject those of dubious quality and reward. The traditional chartist is left to "hope" that their latest breakout trade doesn't turn into a head fake -- a shaky strategy, at best.

Price's Relationship to the Kumo
In its most basic interpretation, when price is trading above the kumo, that is a bullish signal since it indicates current price is higher than the historical average. Likewise, if price is trading below the kumo, that indicates that bearish sentiment is stronger. If price is trading within the kumo, that indicates a loss of trend since the space between the kumo boundaries is the ultimate expression of equilibrium or stasis.
The informed Ichimoku practitioner will normally first consult price's relationship to the kumo in order to get their initial view of a chart's sentiment. From a trading perspective, the Ichimoku chartist will also always wait for price to situate itself on the correct side of the kumo (above for long trades and below for short trades) on their chosen execution time frame before initiating any trades. If price is trading within the kumo, then they will wait to make any trades until it closes above/below the kumo.
Kumo Depth
As you will see upon studying an Ichimoku chart, the kumo's depth or thickness can vary drastically. The depth of the kumo is an indication of market volatility, with a thicker kumo indicating higher historical volatility and a thinner one indicating lower volatility. To understand this phenomenon, we need to keep in mind what the two lines that make up the kumo, the Senkou span A and the Senkou span B, represent. The Senkou span A measures the average of the tenkan sen and kijun sen, so its "period" is between 9 and 26 periods, since those are the two periods that the Tenkan Sen and Kijun Sen measure, respectively. The Senkou span B line, on the other hand, measures the average of the highest high and lowest low price for the past 52 periods. Thus, the Senkou Span A is essentially the "faster" line of the two, since it measures a shorter period of equilibrium.
Consider the chart in Figure III below. For the previous 52 periods, price made a total range of 793 pips (from a high of 1.2672 to a low of 1.1879) The midpoint or average of this range is 1.2275 and that is thus the value of the Senkou span B. This value is then time-shifted forwards by 26 periods so that it stays in front of current price action. The Senkou span A is more reactive to short-term price action and thus is already reflecting the move of price back up from its low of 1.1879 in its positive angle and the gradually thinning kumo. The Senkou span B, on the other hand, is actually continuing to move down as the highest high of the last 52 periods continues to lower as it follows the price curve's move down from the original high of 1.2672. If price continues to rise, the Senkou span A and B will switch places and the Senkou span A will cross above the Senkou span B in a so-called "kumo twist".

The kumo expands and contracts based on market volatility. With greater volatility (i.e., where the price of a given currency pair changes direction dramatically over a short period of time), the faster Senkou span A will travel along in relative uniformity with the price curve while the slower Senkou span B will lag significantly given that it represents the average of the highest high and lowest low over the past 52 periods. Thicker kumos are thus created when volatility increases and thinner ones are created when volatility decreases.
Kumo depth or thickness is a function of price volatility
From a trading perspective, the thicker the kumo, the greater support and resistance it will provide. This information can be used by the Ichimoku practitioner to finetune their risk management and trading strategy. For example, they may consider increasing their position size if their long entry is just above a particularly thick kumo, as the chances of price breaking back below the kumo is significantly less than if the kumo were very thin. In addition, if they are already in a position and price is approaching a very well-developed kumo on another time frame, they may choose to either take profit at the kumo boundary or at least reduce their position size to account for the risk associated with the thicker kumo.
In general, the thicker and more well-developed a kumo is, the greater the support and/or resistance it will provide.
Kumo Sentiment
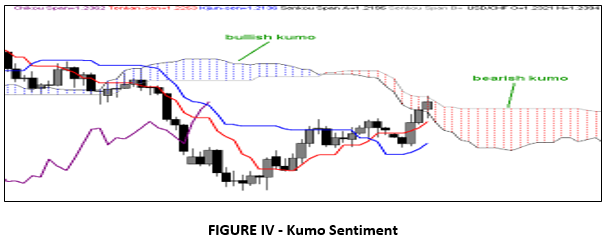
In addition to providing a view of sentiment and its relationship with price, the kumo itself also has its own "internal" sentiment or bias. This makes sense when we consider that the kumo is made up of essentially two moving averages, the Senkou span A and the Senkou span B. When the Senkou span A is above the Senkou span B, the sentiment is bullish since the faster moving average is trading above the slower. Conversely, when the Senkou span B is above the Senkou span A, the sentiment is bearish.
This concept of kumo sentiment can be seen in Figure IV below:
When the Senkou span A and B switch places, this indicates an overall trend change from this longer-term perspective. Ichimoku practitioners thus keep an eye on the leading kumo's sentiment for clues about both current trend as well as any upcoming trend changes. The "Senkou span cross" is an actual trading strategy that utilizes this kumo twist as both an entry as well as a continuation or confirmation signal. More on this strategy is covered in our Ichimoku Trading Strategies section.
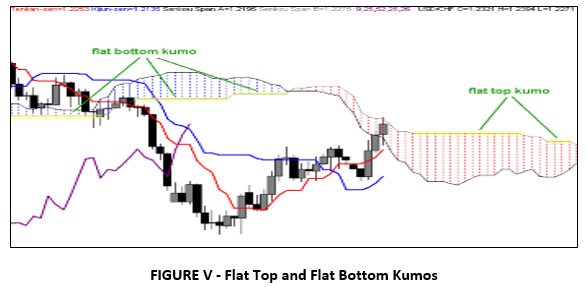
Flat Top/Bottom Kumos
The flat top or bottom that is often observed in the kumo is key to understanding one piece of the kumo's "equilibrium equation." Just like the "rubber band effect" that a flat kijun sen can exert on price, a flat Senkou span B can act in the same way, attracting price that is in close proximity. The reason for this is simple: a flat Senkou span B represents the midpoint of a trendless price situation over the prior 52 periods -- price equilibrium. Since price always seeks to return to equilibrium, and the flat Senkou span B is such a strong expression of this equilibrium, it becomes an equally strong attractor of price.
In a bullish trend, this flat Senkou span B will result in a flat-bottom kumo and in a bearish trend it will manifest as a flat-top kumo. The Ichimoku practitioner can use this knowledge of the physics of the flat Senkou span B in order to be more cautious about both his or her exits out of the kumo. For instance, when exiting a flat bottom (bullish) kumo from the bottom, rather than merely placing an entry order 10 pips below the Senkou span B, savvy Ichimoku practitioners will look for another point around which to build their entry order to ensure they don't get caught in the flat bottom's "gravitational pull." This method minimizes the number of false breakouts experienced by the trader.
See the highlighted areas in the chart for Figure V below for an example of flat-top and flat-bottom kumos:
THE MOVIE
See the full trading education video on the Ichimoku Cloud system explained in this chapter- WATCH THE VIDEO HERE
THE SPECIAL OFFER
Register for the special Introduction to Ichimoku Trade Course. It provides an introduction on how to use the Ichimoku Cloud indicator on any instrument against any time frame. GET YOUR COPY OF THE COURSE HERE
ABOUT THE AUTHOR

After graduating from Georgia Institute of Technology with a Masters in Engineering, Manesh Patel managed engineering projects for firms such as Lucent Technologies and Bell Labs worldwide.
He then retired from the engineering field and became a full-time trader while launching The School of Ichimoku with E.I.I. Capital Group. During this time, Patel built black-box trading modules and worked for institutions on equity and currency trading desks, where he traded through the 2008 financial collapse and 2010 “Flash Crash.” Patel has achieved a Series 3 license and operates as a CTA. Patel also published the book “Trading with Ichimoku Clouds,” published by John Wiley & Sons. Recently, Patel has toured the globe as an instructor, teaching traders how to use Ichimoku Clouds to improve their trading and overall businesses.
Technical systems involve the use of technical indicators, chart patterns, or price action to enter and exit a trade.
Many successful traders use back testing to help them identify the accuracy of a given system. It’s a good idea that is helpful for traders in quite a few ways. It helps them to understand:
Technical traders use systems to trade the market like a business plan. Their rules are well laid out and established in advance. It is their business plan for trading the market and testing that plan allows you to understand your business. It’s a great tool to help traders prepare both emotionally and financially for trading. System Testing is a great tool and I’d recommend it for traders of all skill levels.
Trading systems use well indicators, price and volume, and chart patterns to produce well defined entry and exit points. They are objective not subjective. As such they are easy to interpret and understand when applied to your trading.
One of the questions, a lot of traders have is what is the expectations for price after my buy signal has occurred on a chart? For example, if you are trading with a Bollinger Breakout buy signal, is the price likely to rise? How much? How likely? Where is the price action likely to be afterwards? What would this price movement look like on a chart?
At MetaStock, our engineers designed our Forecaster module to help traders answer these questions. I find it’s beneficial to help establish price targets, stops, and even to confirm entries. It can statistically analyze over 70 different technical events and give you a visual price projection of likely prices.
Let’s take the example of the Bollinger Breakout buy applied to a chart of the Dow ETF (DIA).

In this chart, the Bollinger Band Break out signals are identified by the yellow markers on the chart. These are called event markers.
The software takes these event dates to analyze price movement after the event to generate a probability of price movement. It looks to see what happens with price movement after the event dates. It can be easy to get a bit overwhelmed by the amount of data generated by the forecaster. However, the forecaster takes these statistics and visualizes them in a very easy to understand format.
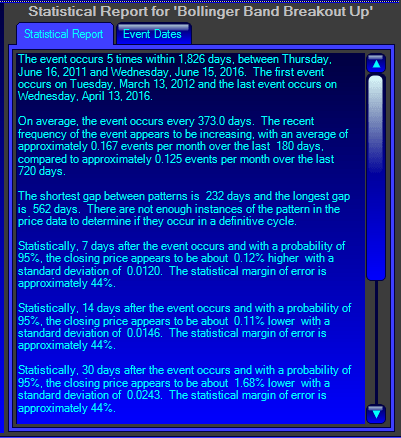
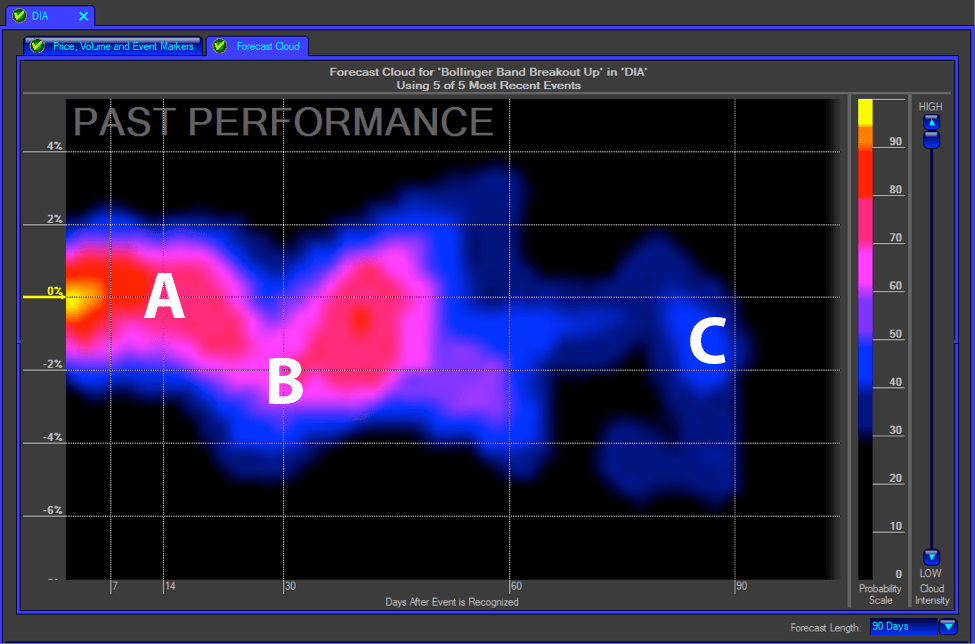
The product of this analysis is a Forecast Cloud. The Forecast Cloud identifies the probability of price movement after a given event. Here’s an example of a Forecast Cloud for DIA:
On the right hand side of the forecast cloud, you will see a probability scale. You’ll notice that brighter colors indicate a higher probability of price action. Orange and yellow equate to a 90%+ probability of a certain price being in a certain area, where the darker areas indicate a lower probability. Underneath you have a measurement of time after the event. Let’s look at a few examples to clarify some examples.
Look at the portion of the cloud I’ve identified as A. Notice a few things about this location:
Based on this region it represents a 0% increase in prices within 14 bars.
Looking at point B on the cloud, we can make similar assumptions. 30 days after the event triggers, the price has declined 2 percent between 70 and 80% of the time after the Bollinger Breakout Triggers.
Looking at point C we can determine that 30-40% of the time the price is between 0 and -2% of its initial price after 90 days after the cloud formation.
It is important to point out about the Forecaster and the analysis that is being done under the hood. The Forecast Cloud is not exclusively using statistics to calculate and display the cloud settings. It uses an extensive set of statistics in its calculations, but it also uses a complex set of patent-pending, proprietary algorithms to allow for expected fluctuations in pricing from its historical patterns.
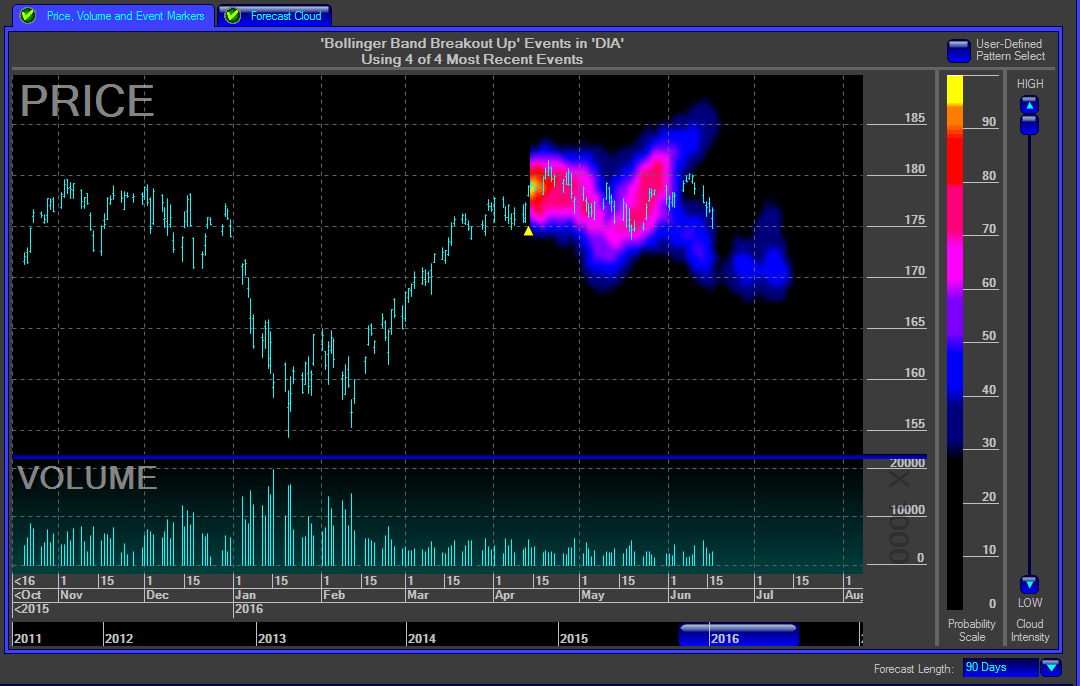
Once a cloud has been generated, it can be overlayed on the chart. This is extremely helpful in determining probable price action following an event. It can also display price action 180 days out into the future.
The Forecaster includes 40 built in event recognizers. These cover a broad range of price, and candlestick events.
In addition, traders that like to use chart patterns have the ability to easily create their own patterns based on their own patterns. Any pattern can be drawn using the Forecasters drawing tools. This means you can easily identify your chart patterns on a chart and easily perform statistical analysis using the tool.
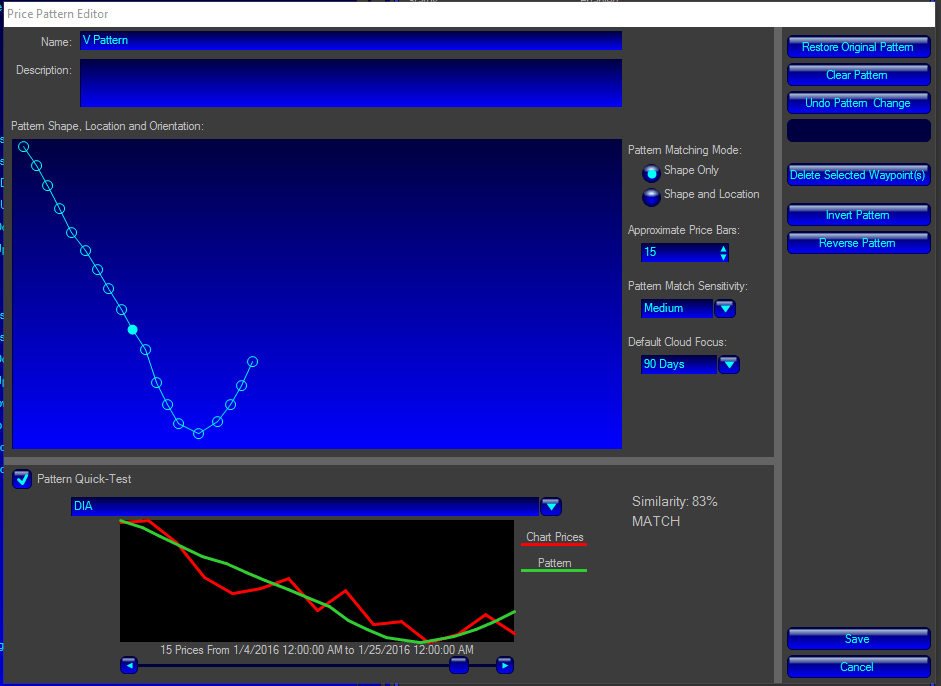
In this example, I’ve created the bottom formation of a V Pattern. There are options for your drawn patterns for shape, number of price bars, pattern sensitivity, and the focus for the cloud on the chart. Once you’ve completed your hand drawn pattern, you can identify your entries and exits on a chart using event markers.
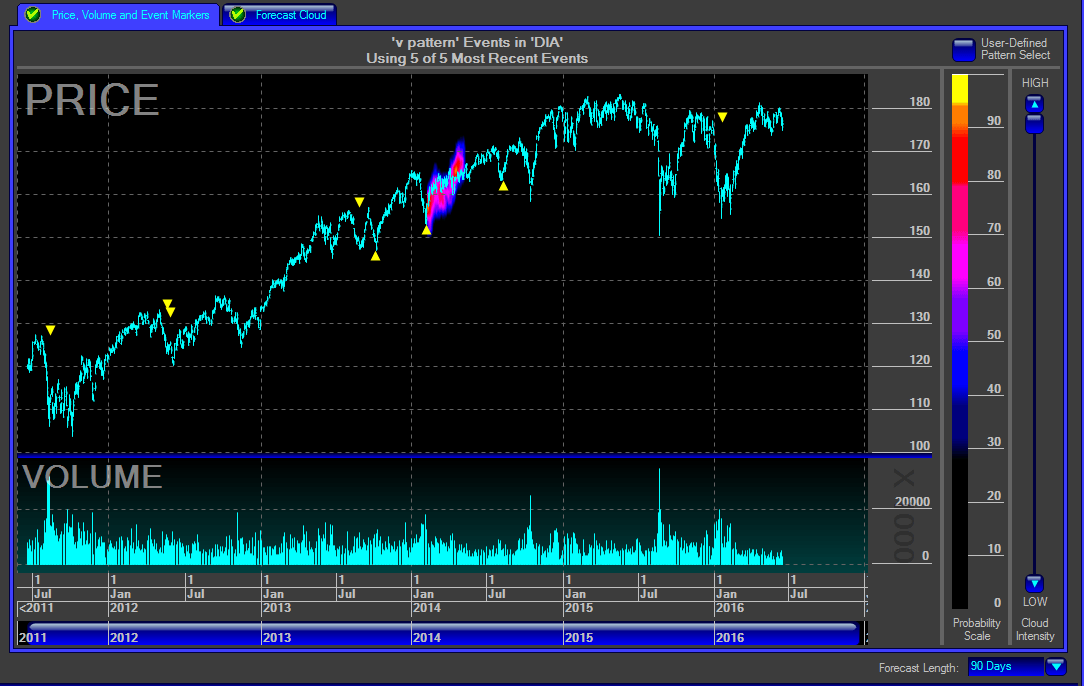
Using the hand drawn patterns allows you to easily identify your patterns on a chart. It also provides an event driven forecast cloud.
One of my most interesting uses of the Forecaster is to use recent price activity to establish a pattern. Most of the time when I am using the Forecaster, I’ve already made a decision to buy or sell a specific instrument. You can create a forecast event using current data by defining it on a chart.
As an example, let’s say that we are looking at a short opportunity for DIA on June 15 2016. Using the Forecaster, I can create a pattern based on any of the available chart data.
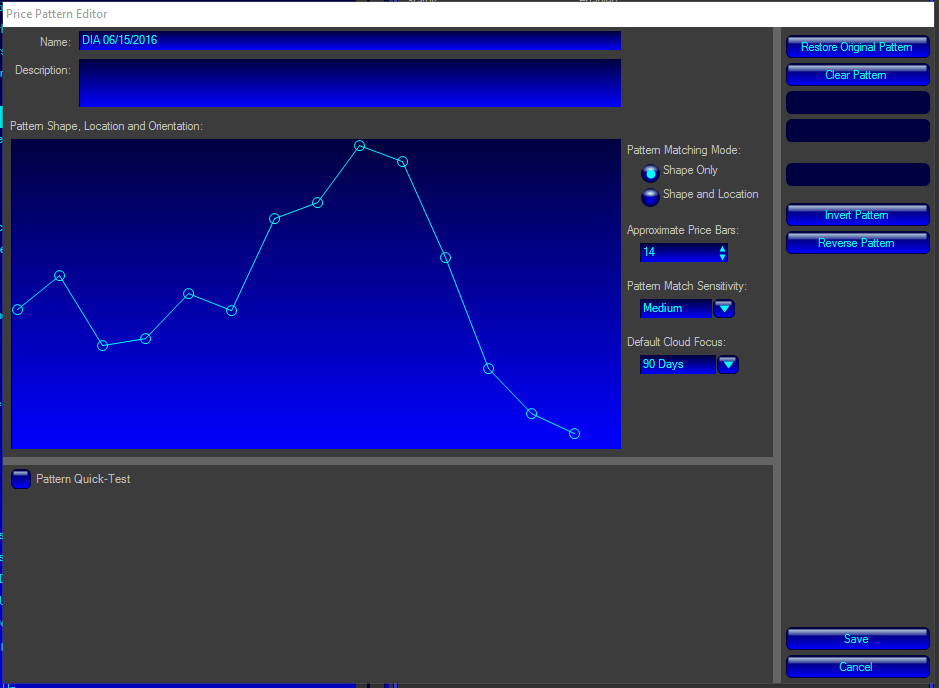
In this example, I’ve taken the last 14 days of chart data to establish a hand drawn pattern. Once created, I can scan the chart and get a good idea of the following:
Here’s a graphic of the forecast cloud generated from the June 15th DIA event:

Here are the assumptions we can make from this chart when we understand the forecast cloud.
I find this information to be extremely valuable to help me confirm my trading decisions, set profit targets, and identify an exit strategy. It’s a great tool in MetaStock and something I would recommend you include in your trading arsenal. In case you aren’t familiar with MetaStock, the software has been rated number one in its price category by the readers of Technical Analysis of Stocks and Commodities 24 times in a row. It is designed to help traders by finding the right strategies on the right stock at the right time.
THE SPECIAL OFFER
We do have some great supporting videos and I'd recommend that you watch our video on the Forecaster, System Testing, and Scanning at www.metastock.com/tradingpub . While you are there, take a risk free trial of MetaStock for 30 days.
As always, with all new methods that you paper trade it until you are comfortable. Then as anything else you use with your trading ease into it with smaller positions until you feel you are ready to go full scale.
ABOUT THE AUTHOR

Jeffrey Gibby has been working for MetaStock for over nineteen years. He is currently in charge of new business development and works to create new MetaStock distributors and partners worldwide.
Mr. Gibby works with training companies to help people learn the power of MetaStock. He has spoken to traders from around the world and has trained people on how to use the software and trade various markets. Among his areas of responsibilities are the management of new products and services for MetaStock and creating strategic partnerships.
Disclosure: The author of this article had an active position in DIA during the writing of this article.